
How To Build a Custom Table
Follow these simple steps to build a custom table:
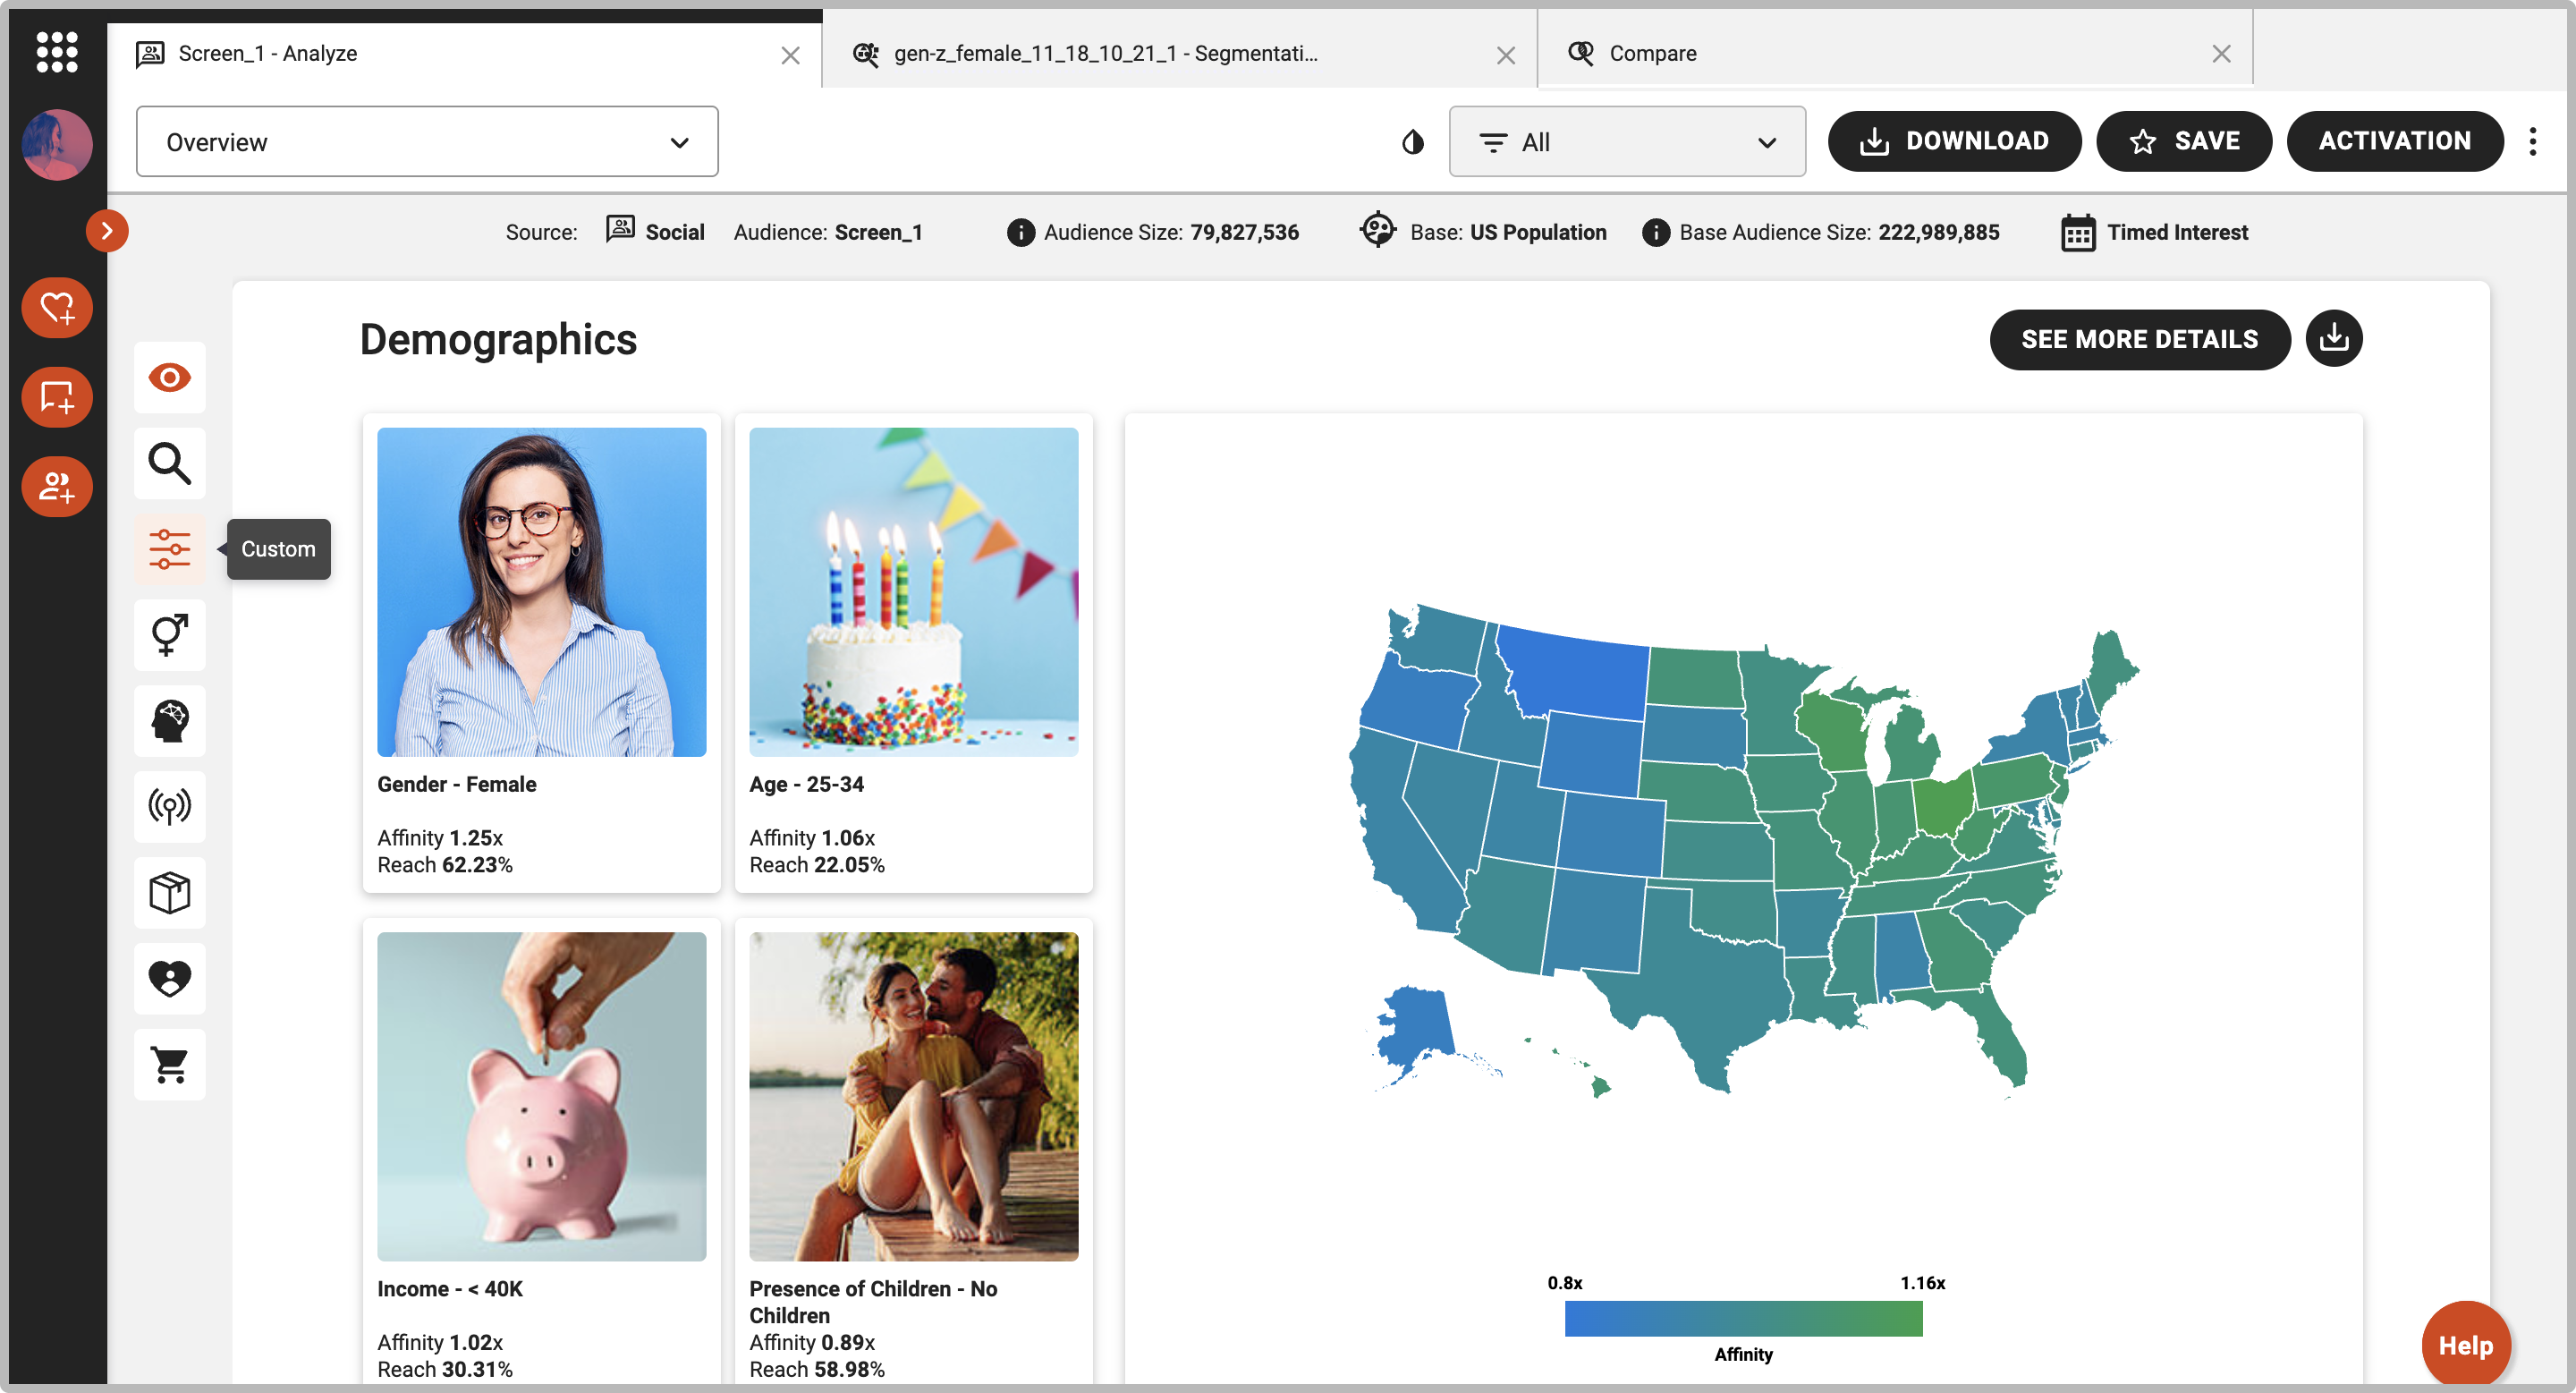
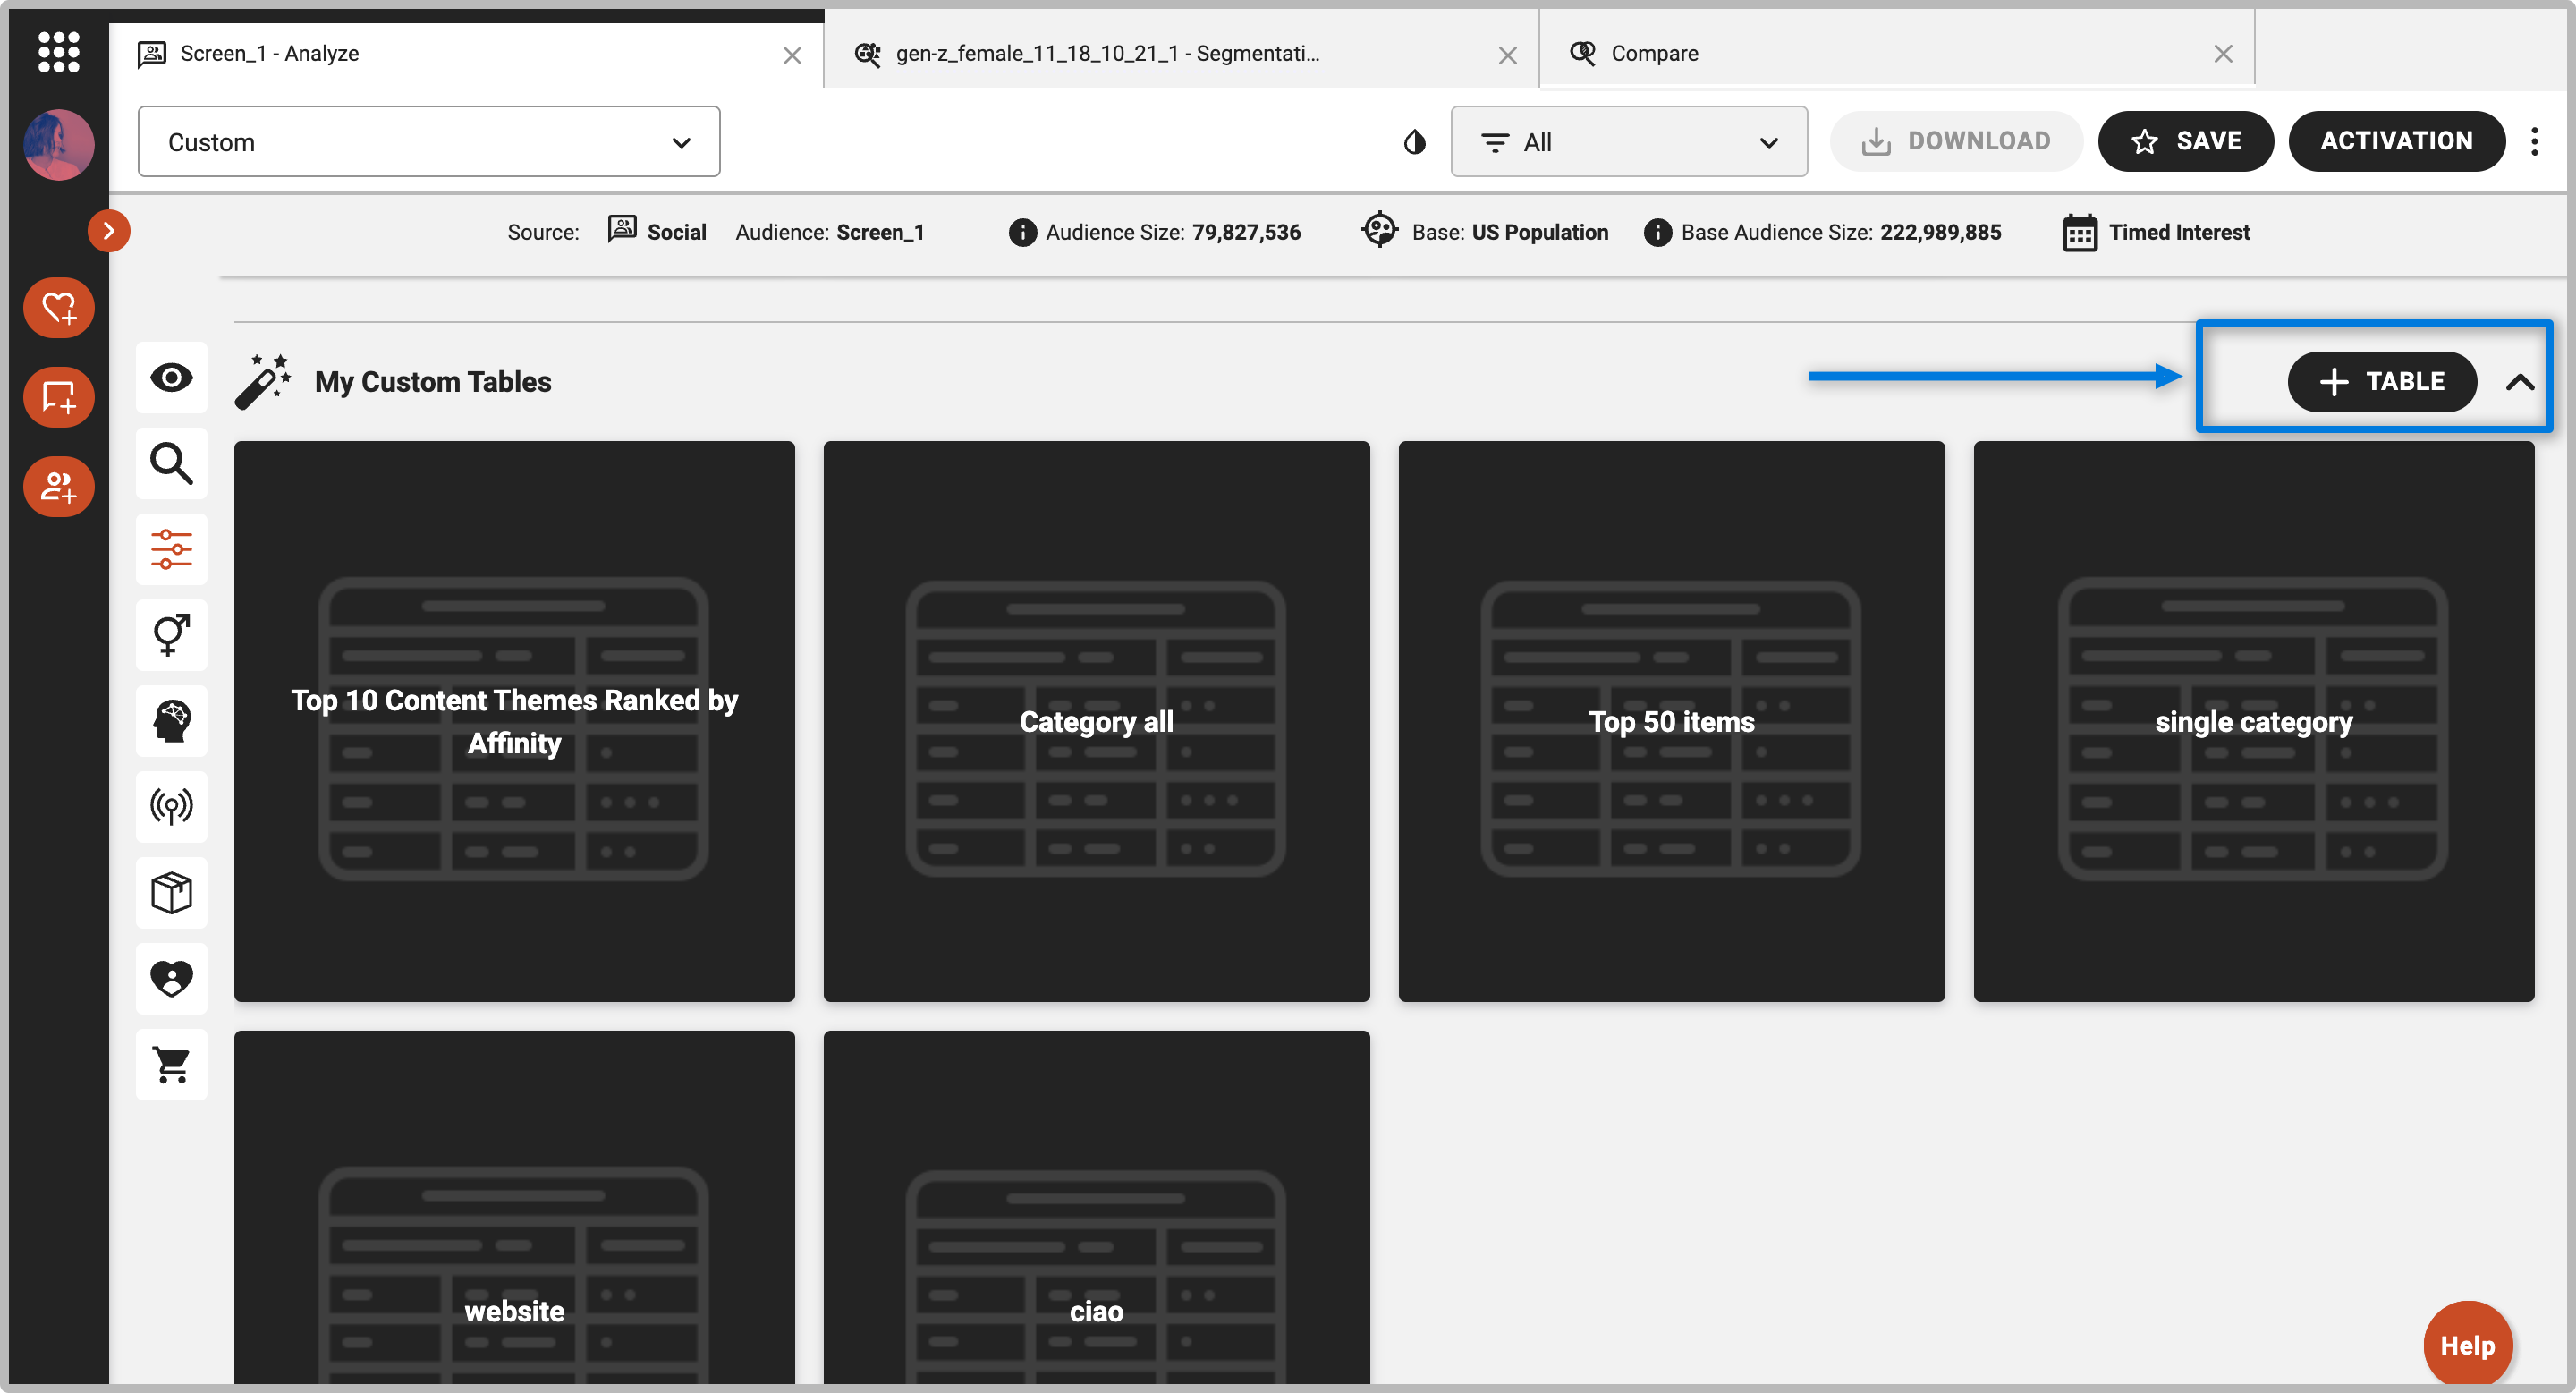
- Once you’ve finished running a search query and land on the Overview page, click on the “Custom” icon that you see on the left navigation panel to get to the Custom Tables and Templates section.
2. Begin creating a custom table by scrolling down the page and then pressing the (+ TABLE) option
3. The first step is selecting the data for your custom table. Use the "Search" option to add the specific brand, influencer, psychographic trait, product/service category or influencer category that you want to include in your custom table. The Discover platform will automatically pull the list of items that match your search term. You can also search using the drop down menu, which guides you through Discover's interest and influencer taxonomy. For Discover clients who subscribe to the MRI or Simmons Research Data Fusion, you’ll also see additional consumption data options from MRI or Simmons.
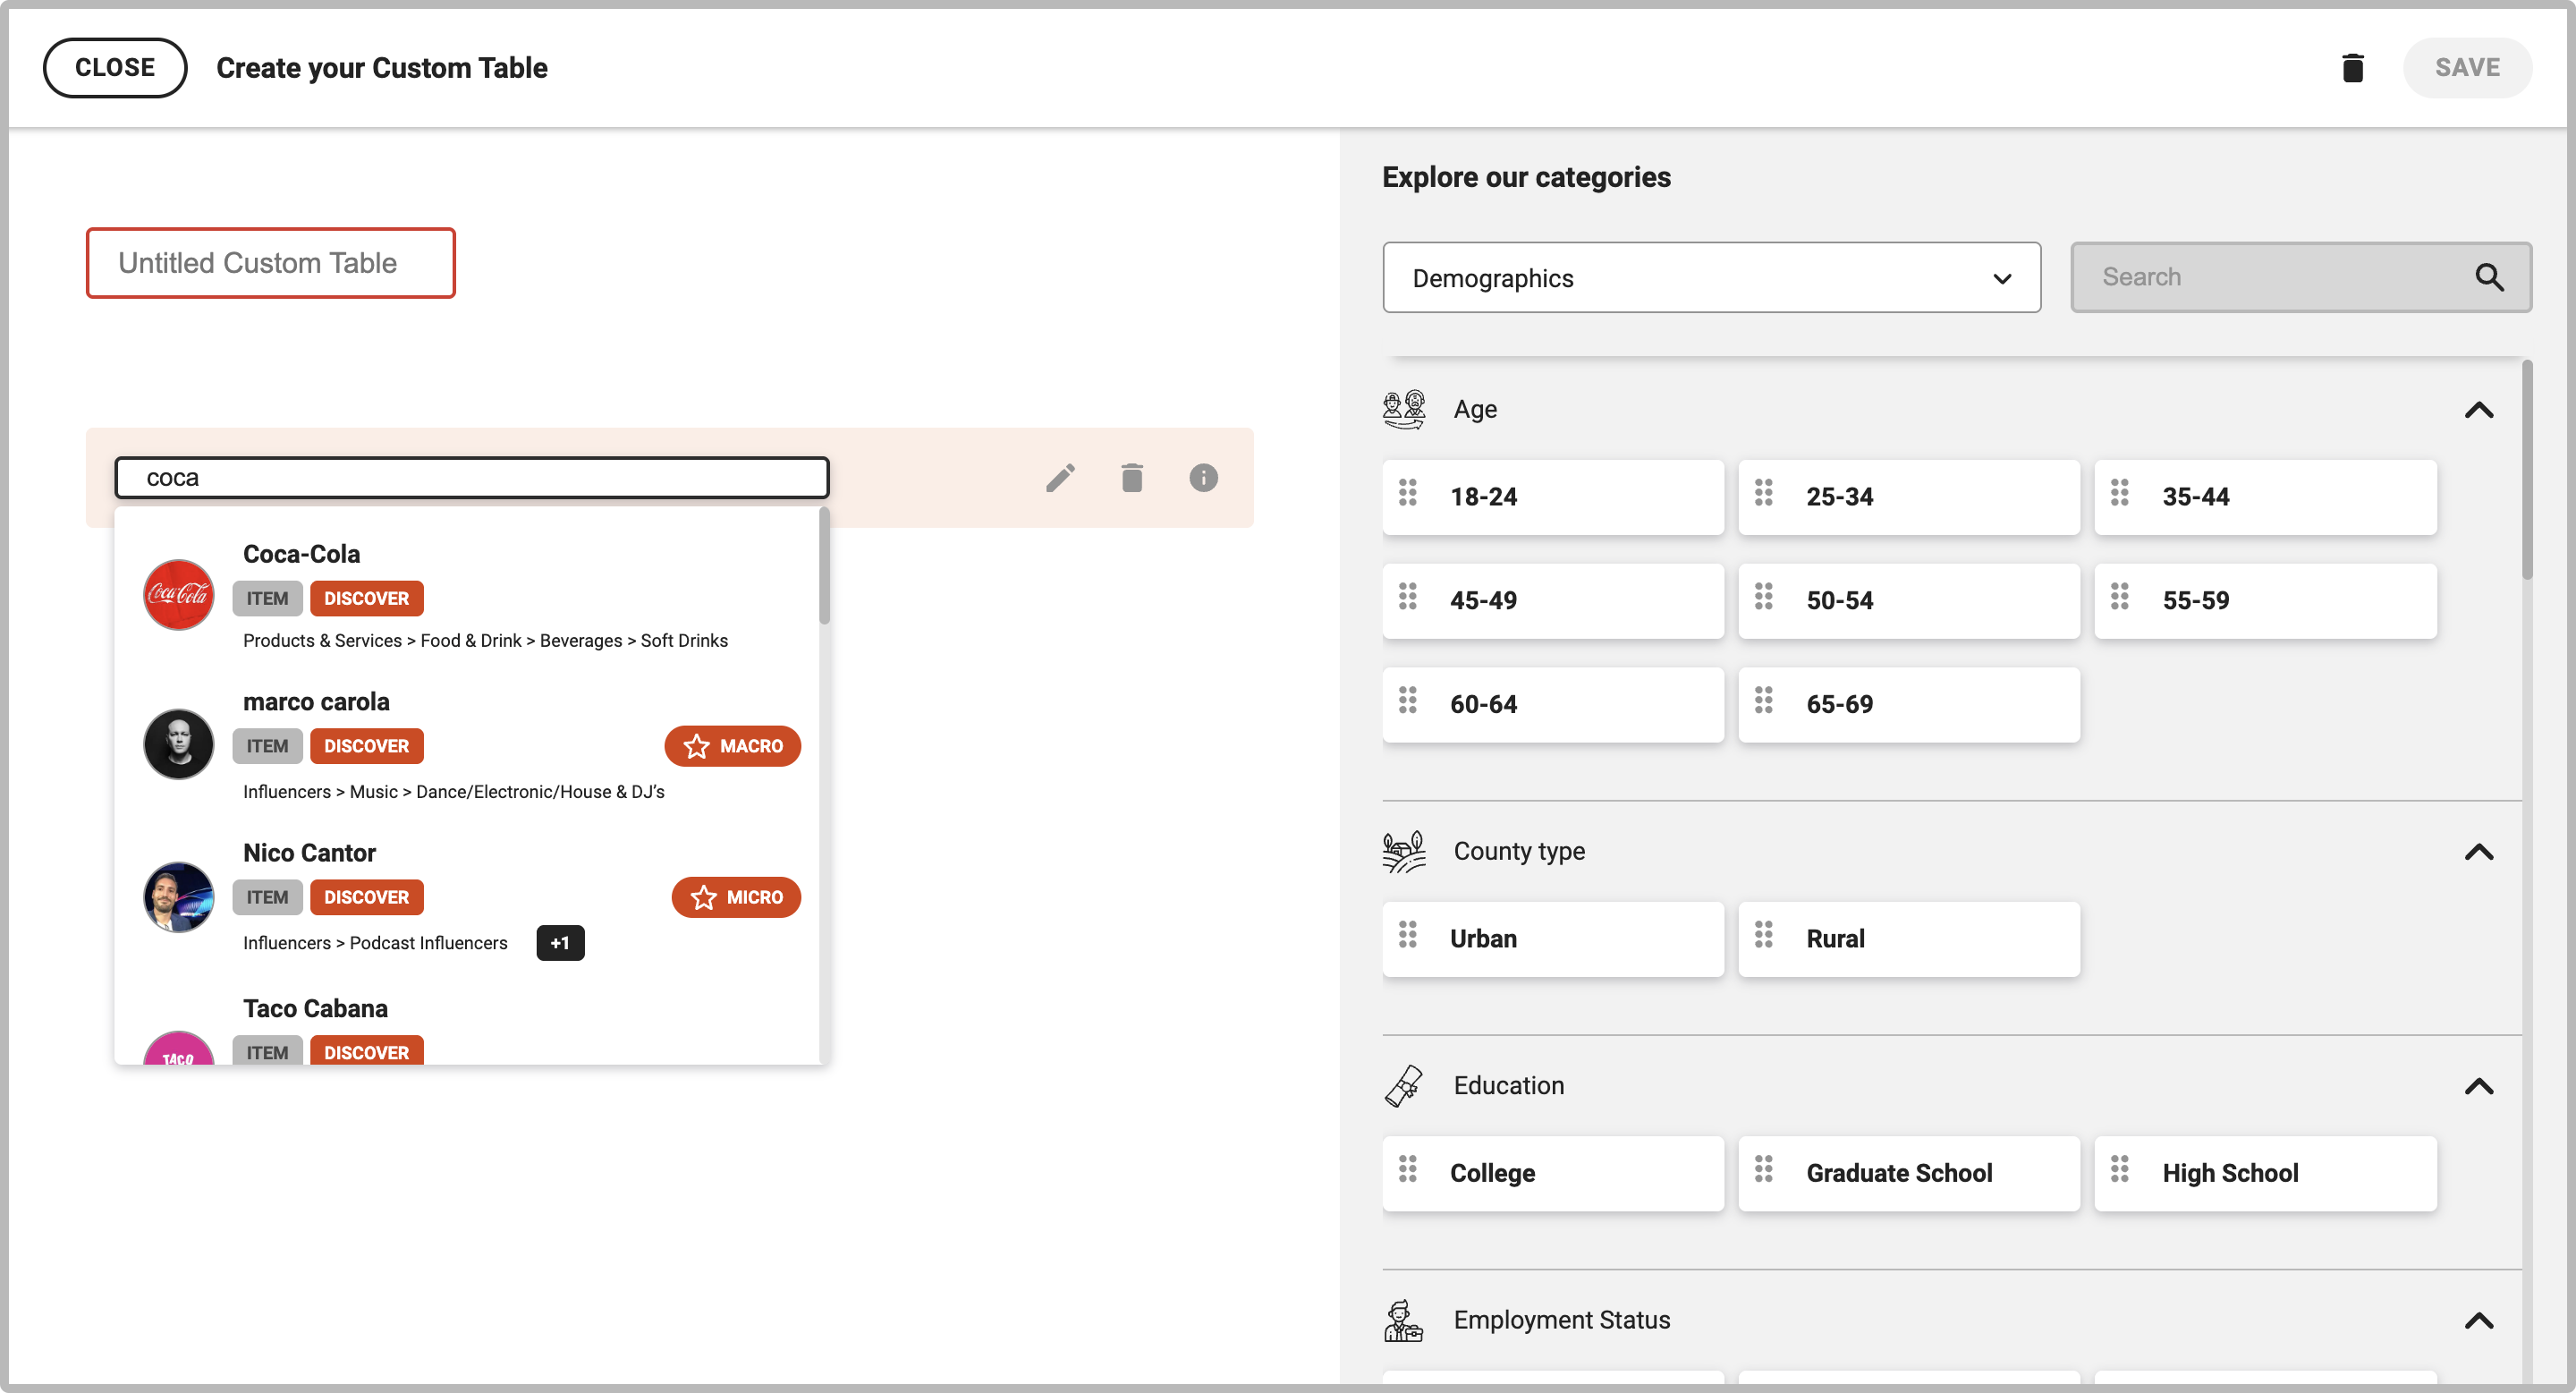
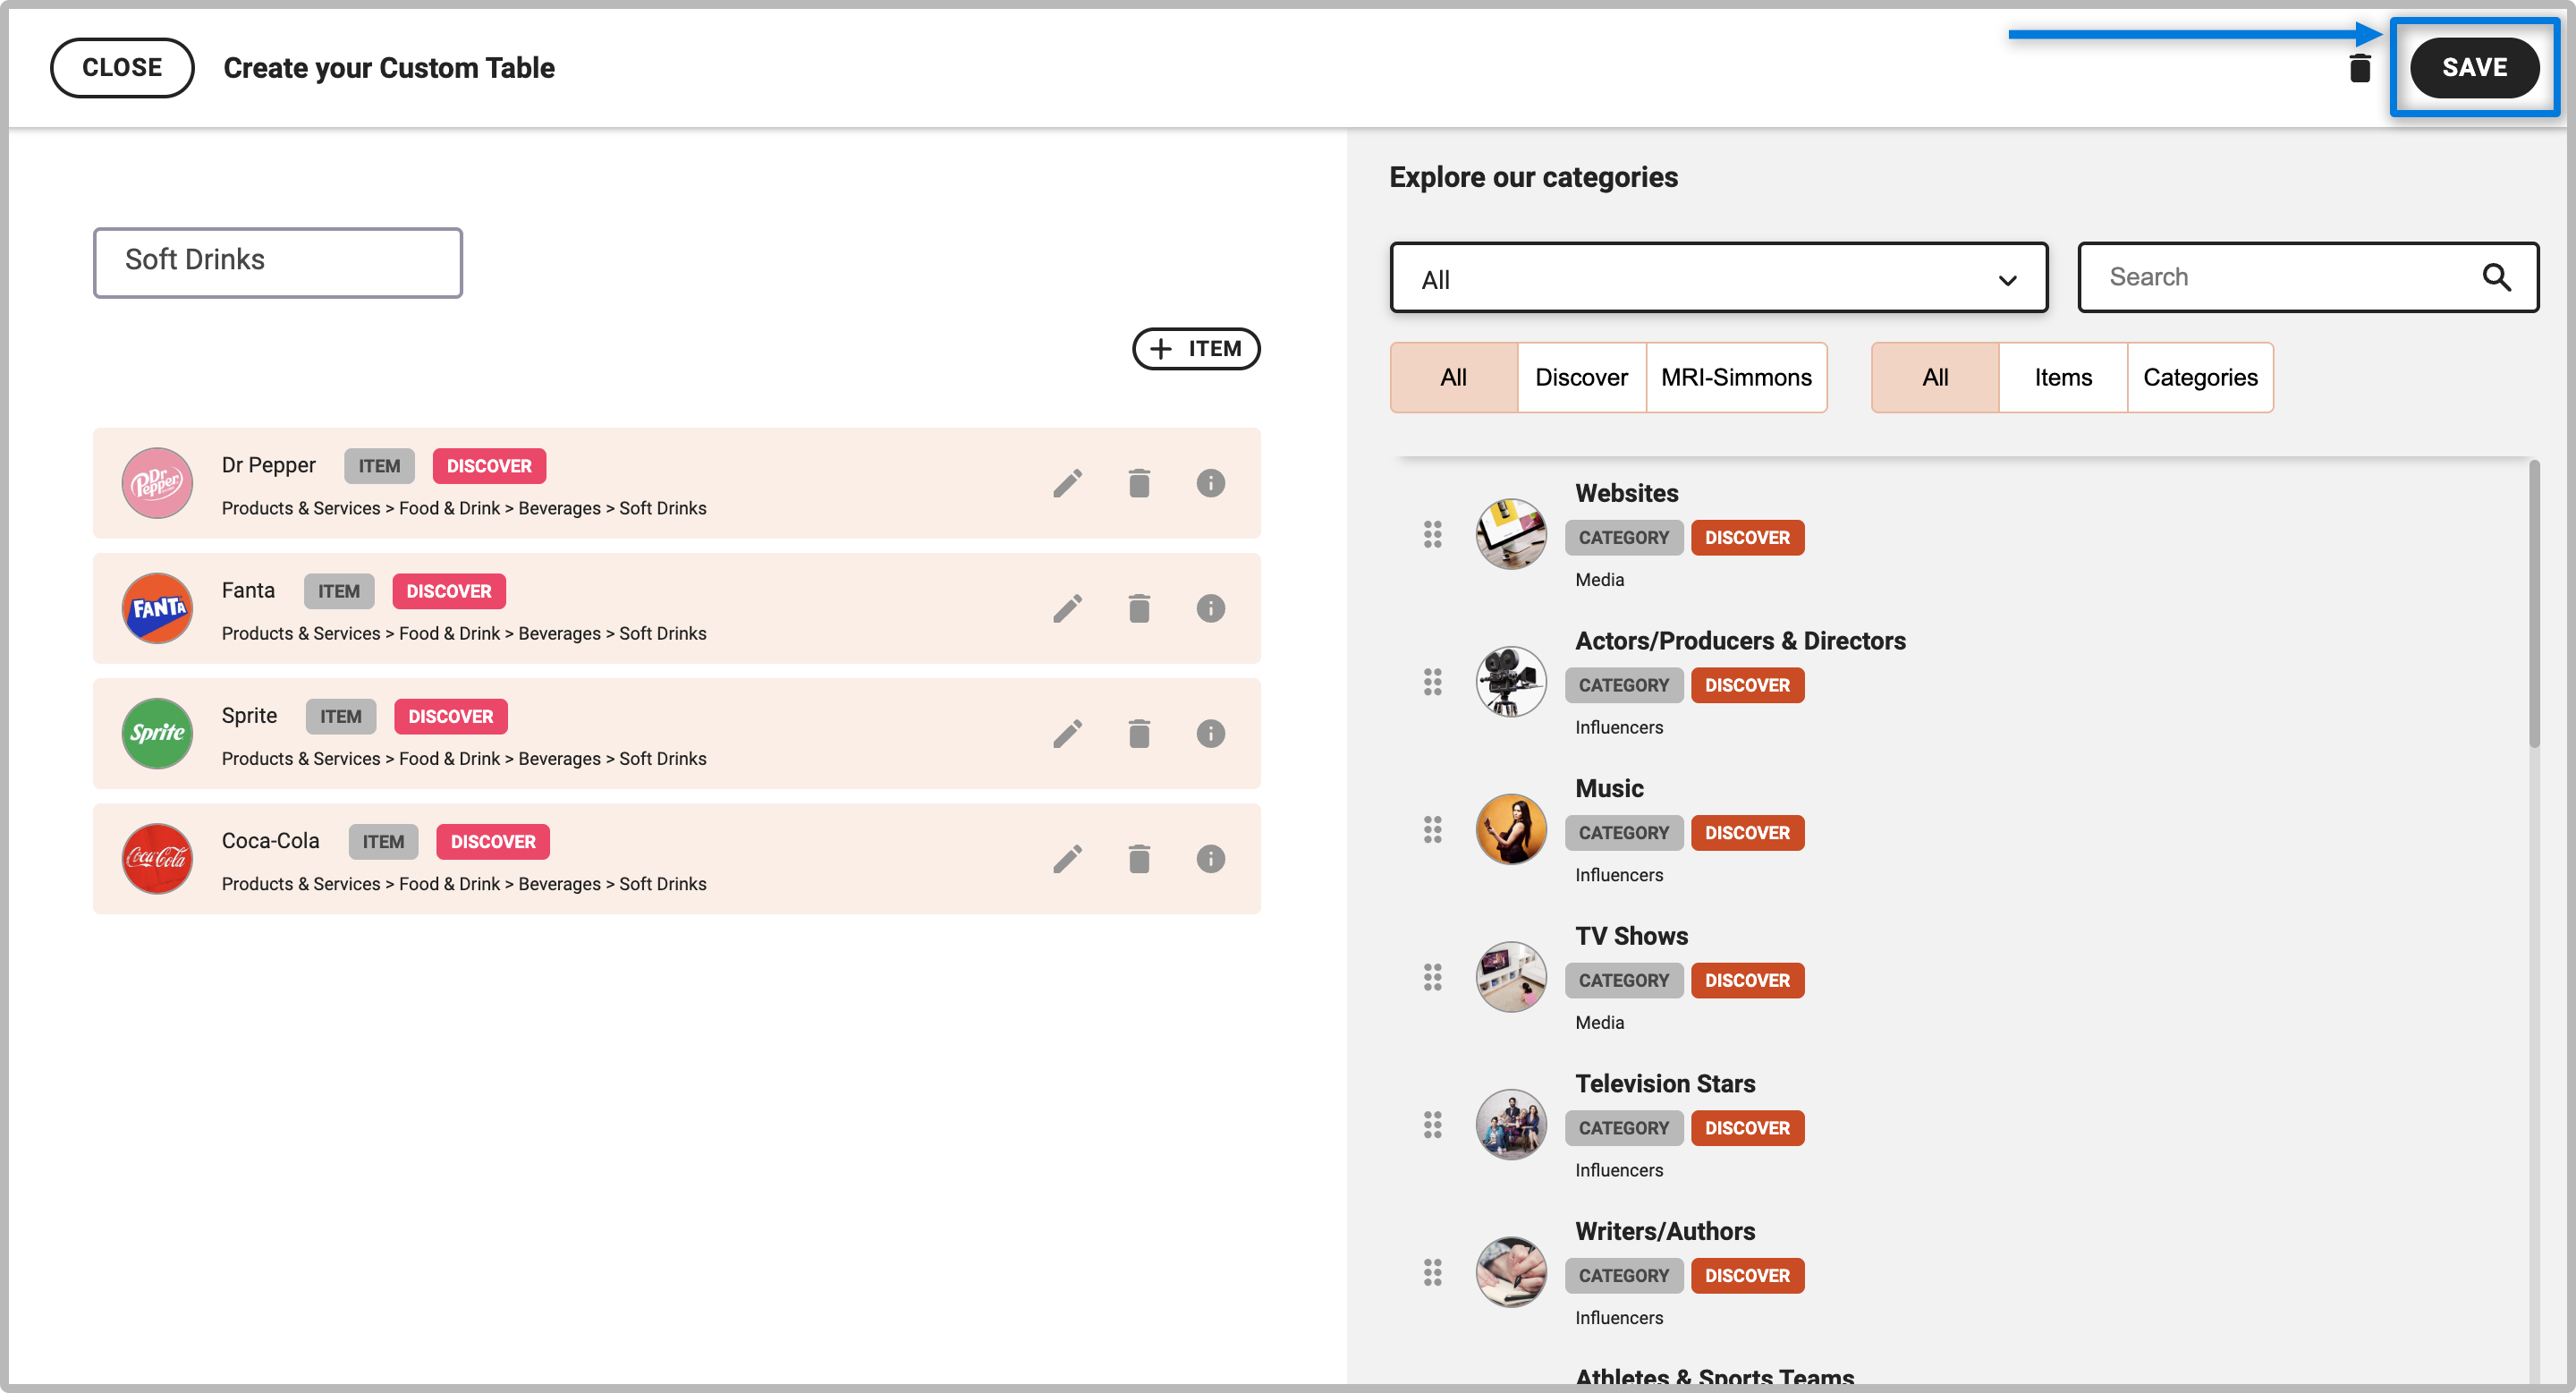
4. Your item will appear in the "Table preview" field on the left of the screen.
5. After you have added all the items or categories you’d like and have given your table a name, press the "Save" button at the top right.
Helpful Tips:
- To add your custom table to a new or existing custom template, click the "+" icon located on the top right corner of the table
- To download your custom summary as a JPG, PDF, PPT, XLS or HTML file, click the down arrow "download" icon.
- For any tables and charts in the platform, you can click on the Edit icon to set the filters to customize the data outputs.