
Affinity, Reach, Penetration, Base, and Relevancy: How Discover Determines Interest
What factors are used to determine interest?
Discover’s interest calculation is based on social engagement. If an audience is significantly more engaged within a topic than the base population, they are considered interested. Multiple factors are considered when determining interest and affinity, including the type of interaction, frequency of interaction, and recency of interaction.
- Type: Different types of interactions are weighted differently in the affinity calculation, as some forms of engagement take more effort and therefore indicate a higher level of interest. For example, retweeting or taking the time to reply to a brand’s content has a higher weight than just liking a post.
- Frequency: If an audience is interacting frequently with a brand or influencer, that tells us they are very interested in that topic. For example, someone interacting with every post from a brand would be more interested than someone who only followed and never engaged further. Higher frequency indicates a higher level of affinity in our algorithm.
- Recency: In order to prioritize more recent data and to keep insights relevant, more recent interactions are given a higher weight in Discover’s affinity calculation than older ones.
Interest Versus Timed Interest
In the query builder, you may notice there are two different options for building your interest-based query: Interest, and Timed Interest. Interest is Discover's proprietary affinity modeling that blends followers and engagers to determine interest.
Timed interest is the interest an audience shows in a fixed time period. Timed interest does not include follows as a form of engagement, since follows alone do not have a time component.
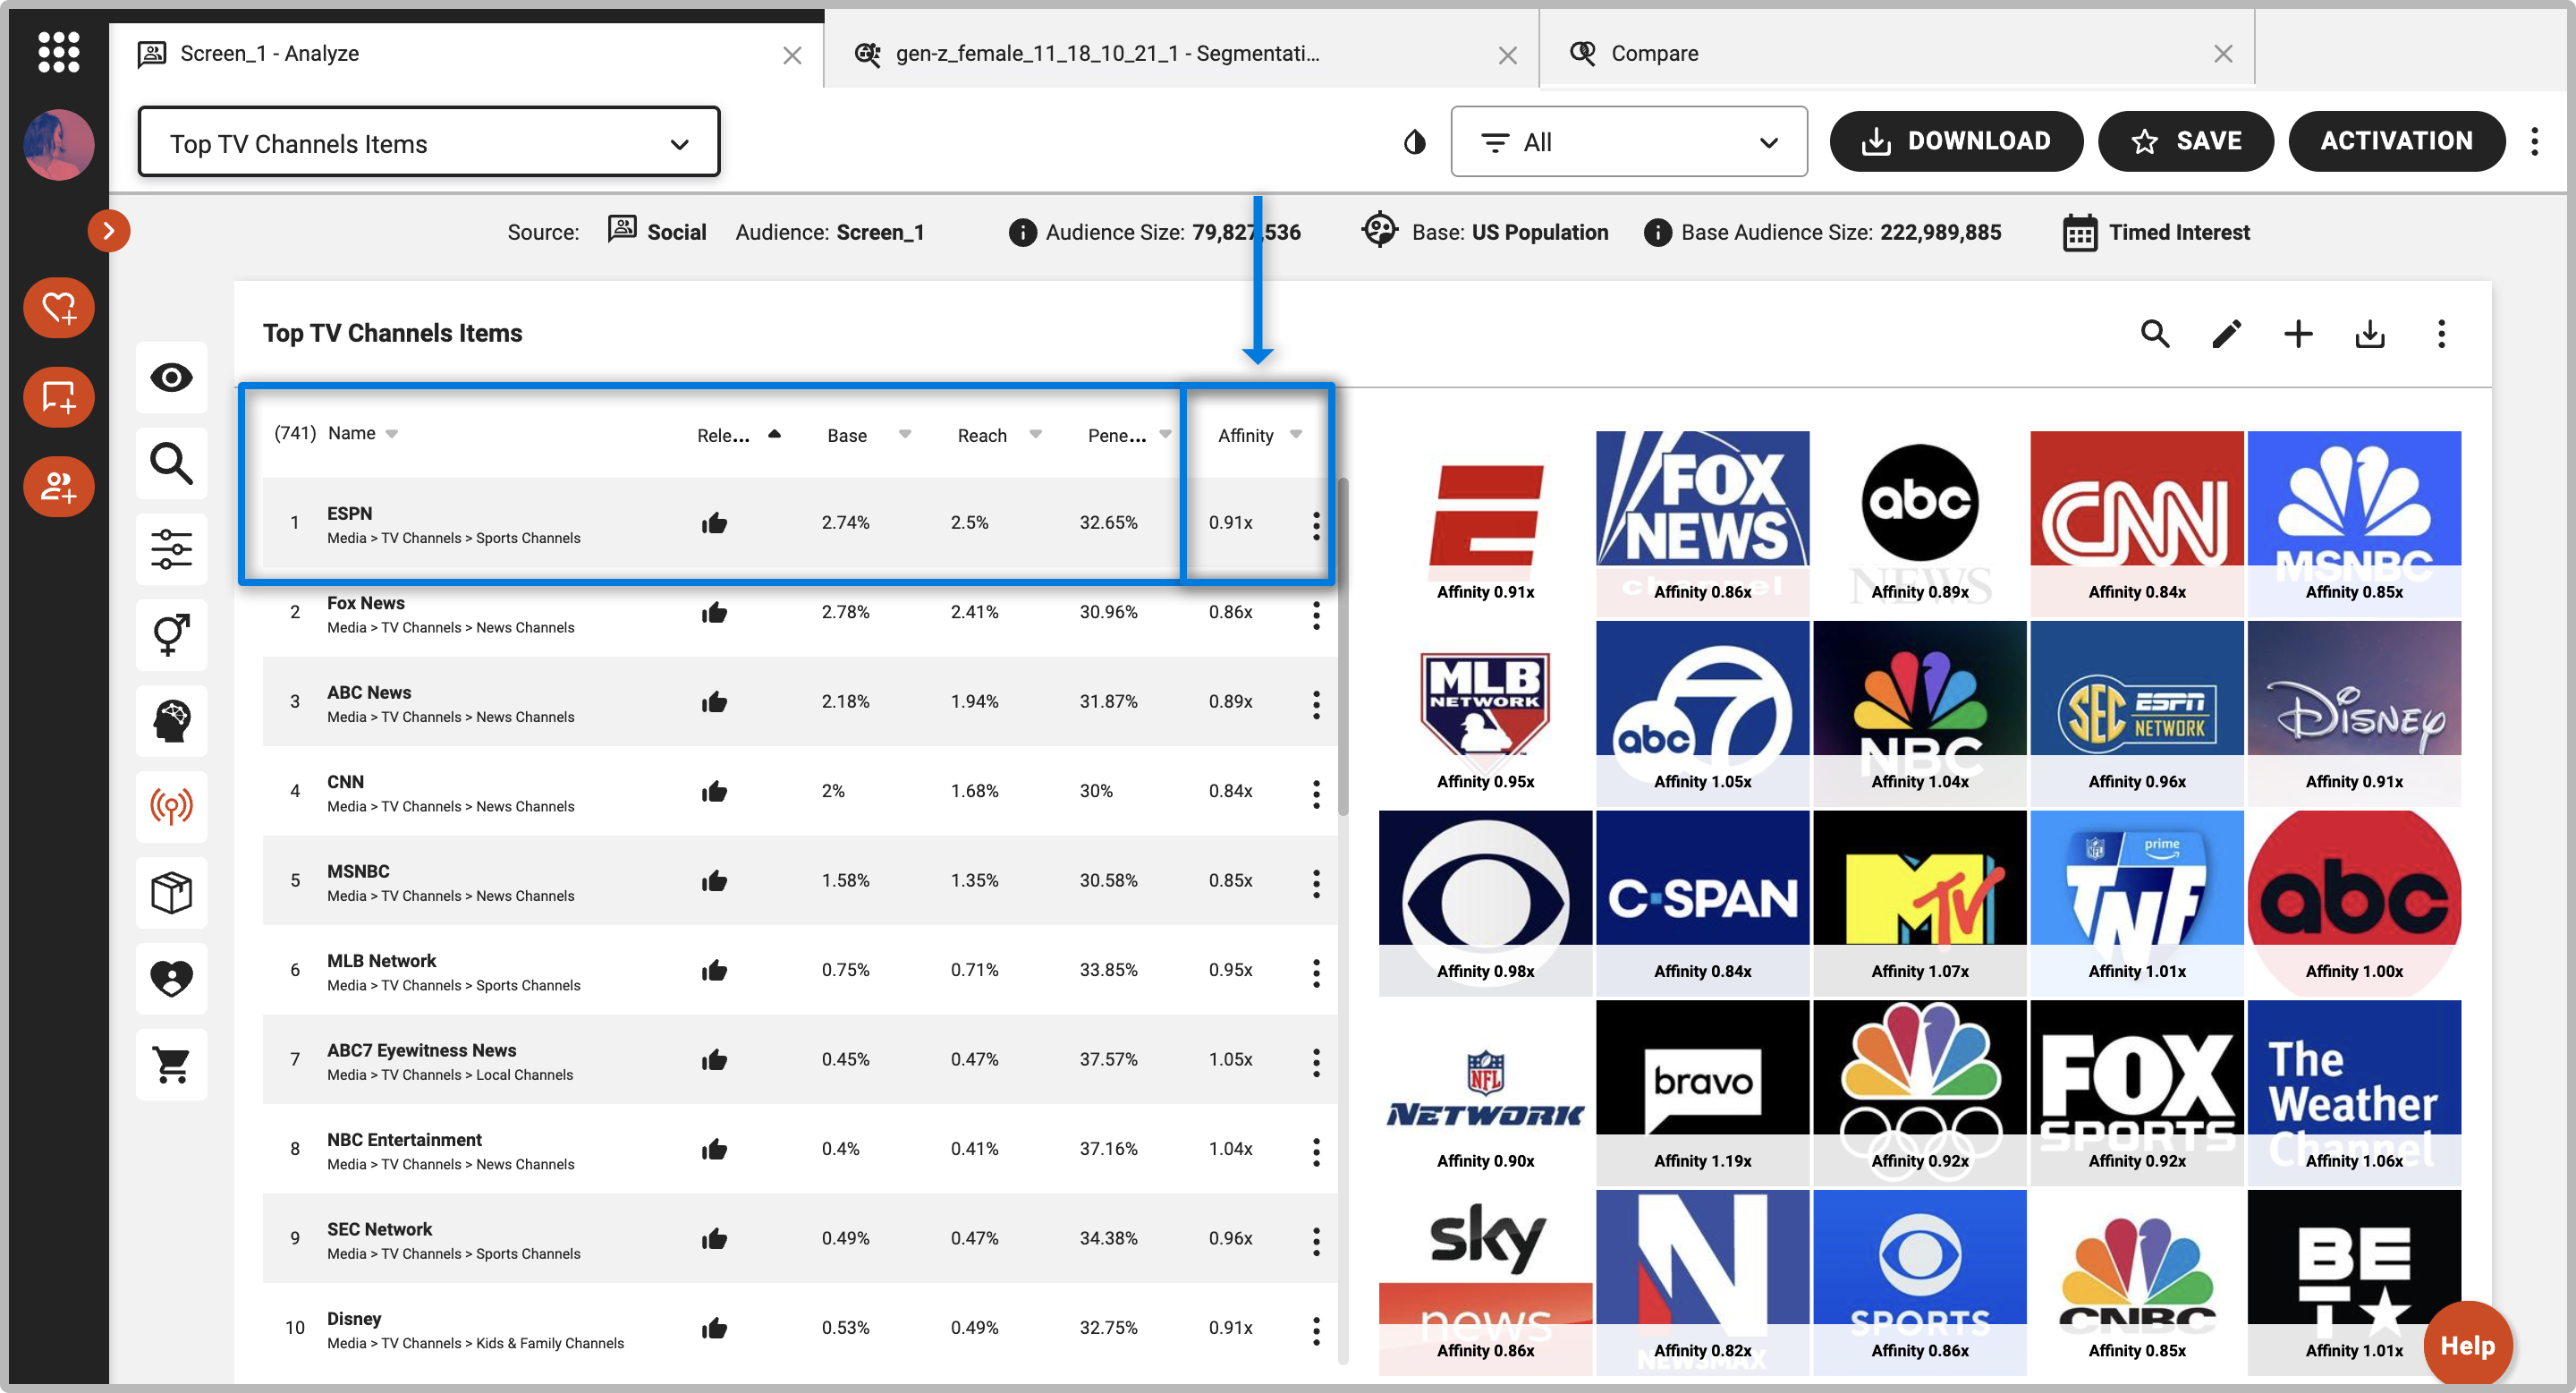
Affinity Definition
Affinity is Discover’s signature behavioral metric which tells you how interested a specific audience is in various topics relative to the base population. Affinity also tells you how likely a specific audience is to have certain demographic traits, lifestyles, and the influencers that inspire them compared to the base population.
The Affinity Index in the Discover platform calculates how the audience you are analyzing is different from your base population. Affinity is the leading indicator of what is distinctive and unique for your audience.
How to Read and Interpret Affinity
The Affinity Index can fall within the following ranges:
- 0 < Affinity < 1: There is an absence of signal from your audience towards this interest compared to the average American adult
- Affinity = 1: Your audience is as interested in the item as the base population
- Affinity > 1: your audience is more interested in the item than the base population
Anything above 1.15x is considered to be a significantly high affinity. Below 0.85x is considered significantly low. Anything between 0.85 and 1.15 is considered to be in line with the base population.
In the above example, you would read affinity as: People interested in Chipotle are 2.32x more interested in MTV than the average american.
Using it in a sentence: [target audience] is ZZx more interested in [item/product] than the [base population].
Affinity Calculation Formula
The Affinity Index for an interest item (e.g., Panera Bread) or a psychographic trait (e.g., Fast Food Fans) is calculated using the following formula:

Where:
- A is the users in the selected target audience
- N is the users who are interested in a certain item
- P is all users in our consumer sample (~10M)
Let’s walk through this formula using a simple example. Assume that you’re interested in calculating the Affinity Index for Panera Bread among Millennials in Discover. Then, using the definition above:
- A = Users in our consumer sample who are Millennials
- N = Users in our consumer sample who have interacted with Panera Bread on social media
- P = All users in our consumer sample
Therefore, the formula used to calculate the Affinity Index for Panera Bread among Millennials is:

In summary, the Affinity Index measures the ratio of Reach for a given item (Panera Bread) within a defined target (Millennials) to the Reach for a given item (Panera Bread) for the base population.
The formula is then adjusted to normalize for the individual differences in the overall level of social media engagement to prevent heavy social media users from skewing the result.
Reach Definition
The Reach measurement calculates the percentage of consumers within your target audience who share a specific trait or interest. Reach helps you understand the portion of your audience that is interested.
How to Read and Interpret Reach
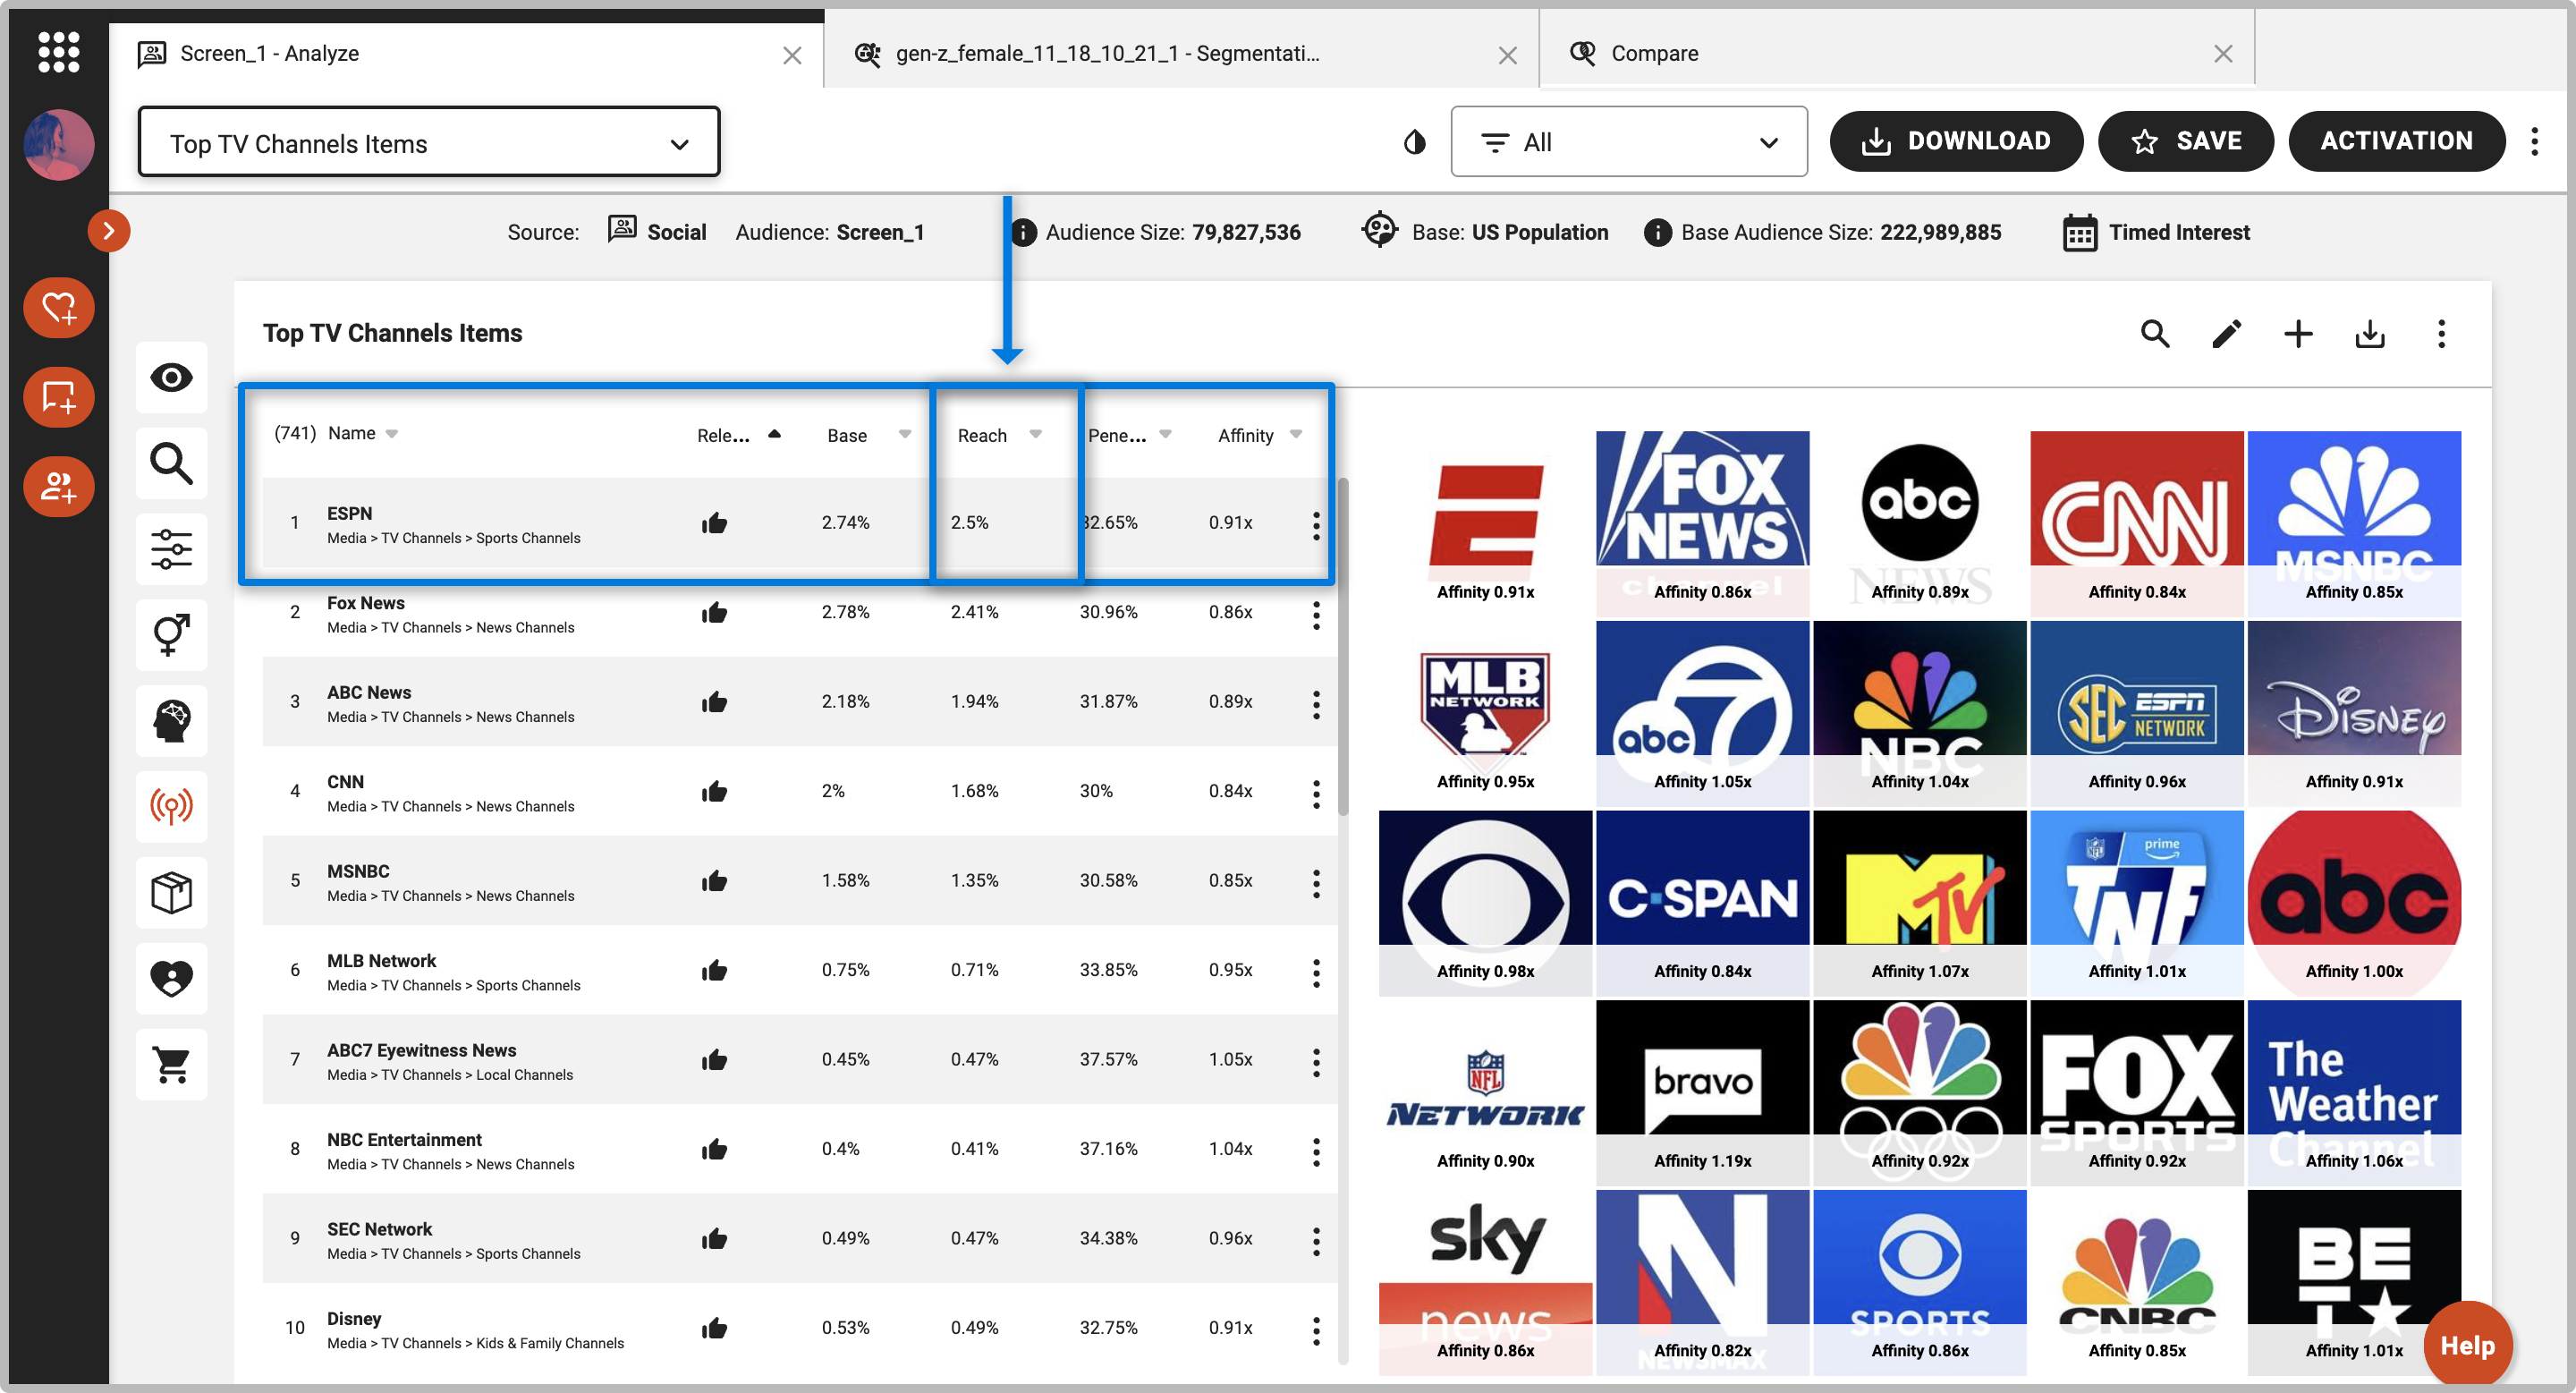
In the above example, you would read reach as: 25.48% of those interested in Chipotle are interested in MTV.
For most marketers, you’ll want to balance Affinity and Reach to ensure you’re identifying those interests and traits that are most unique to your audience, and have the most impact.
Unlike Affinity, Reach will vary greatly depending on how niche your audience is, and depending on what category you are looking at. Because of this, there is no minimum or maximum reach percentage that is considered significant.
Using it in a sentence: ZZ% of [queried audience] is interested in [item/product]
Penetration Definition
Penetration calculates the percentage of all American adult consumers who have a specific trait/interest that fall within your queried audience.
How to Read and Interpret Penetration
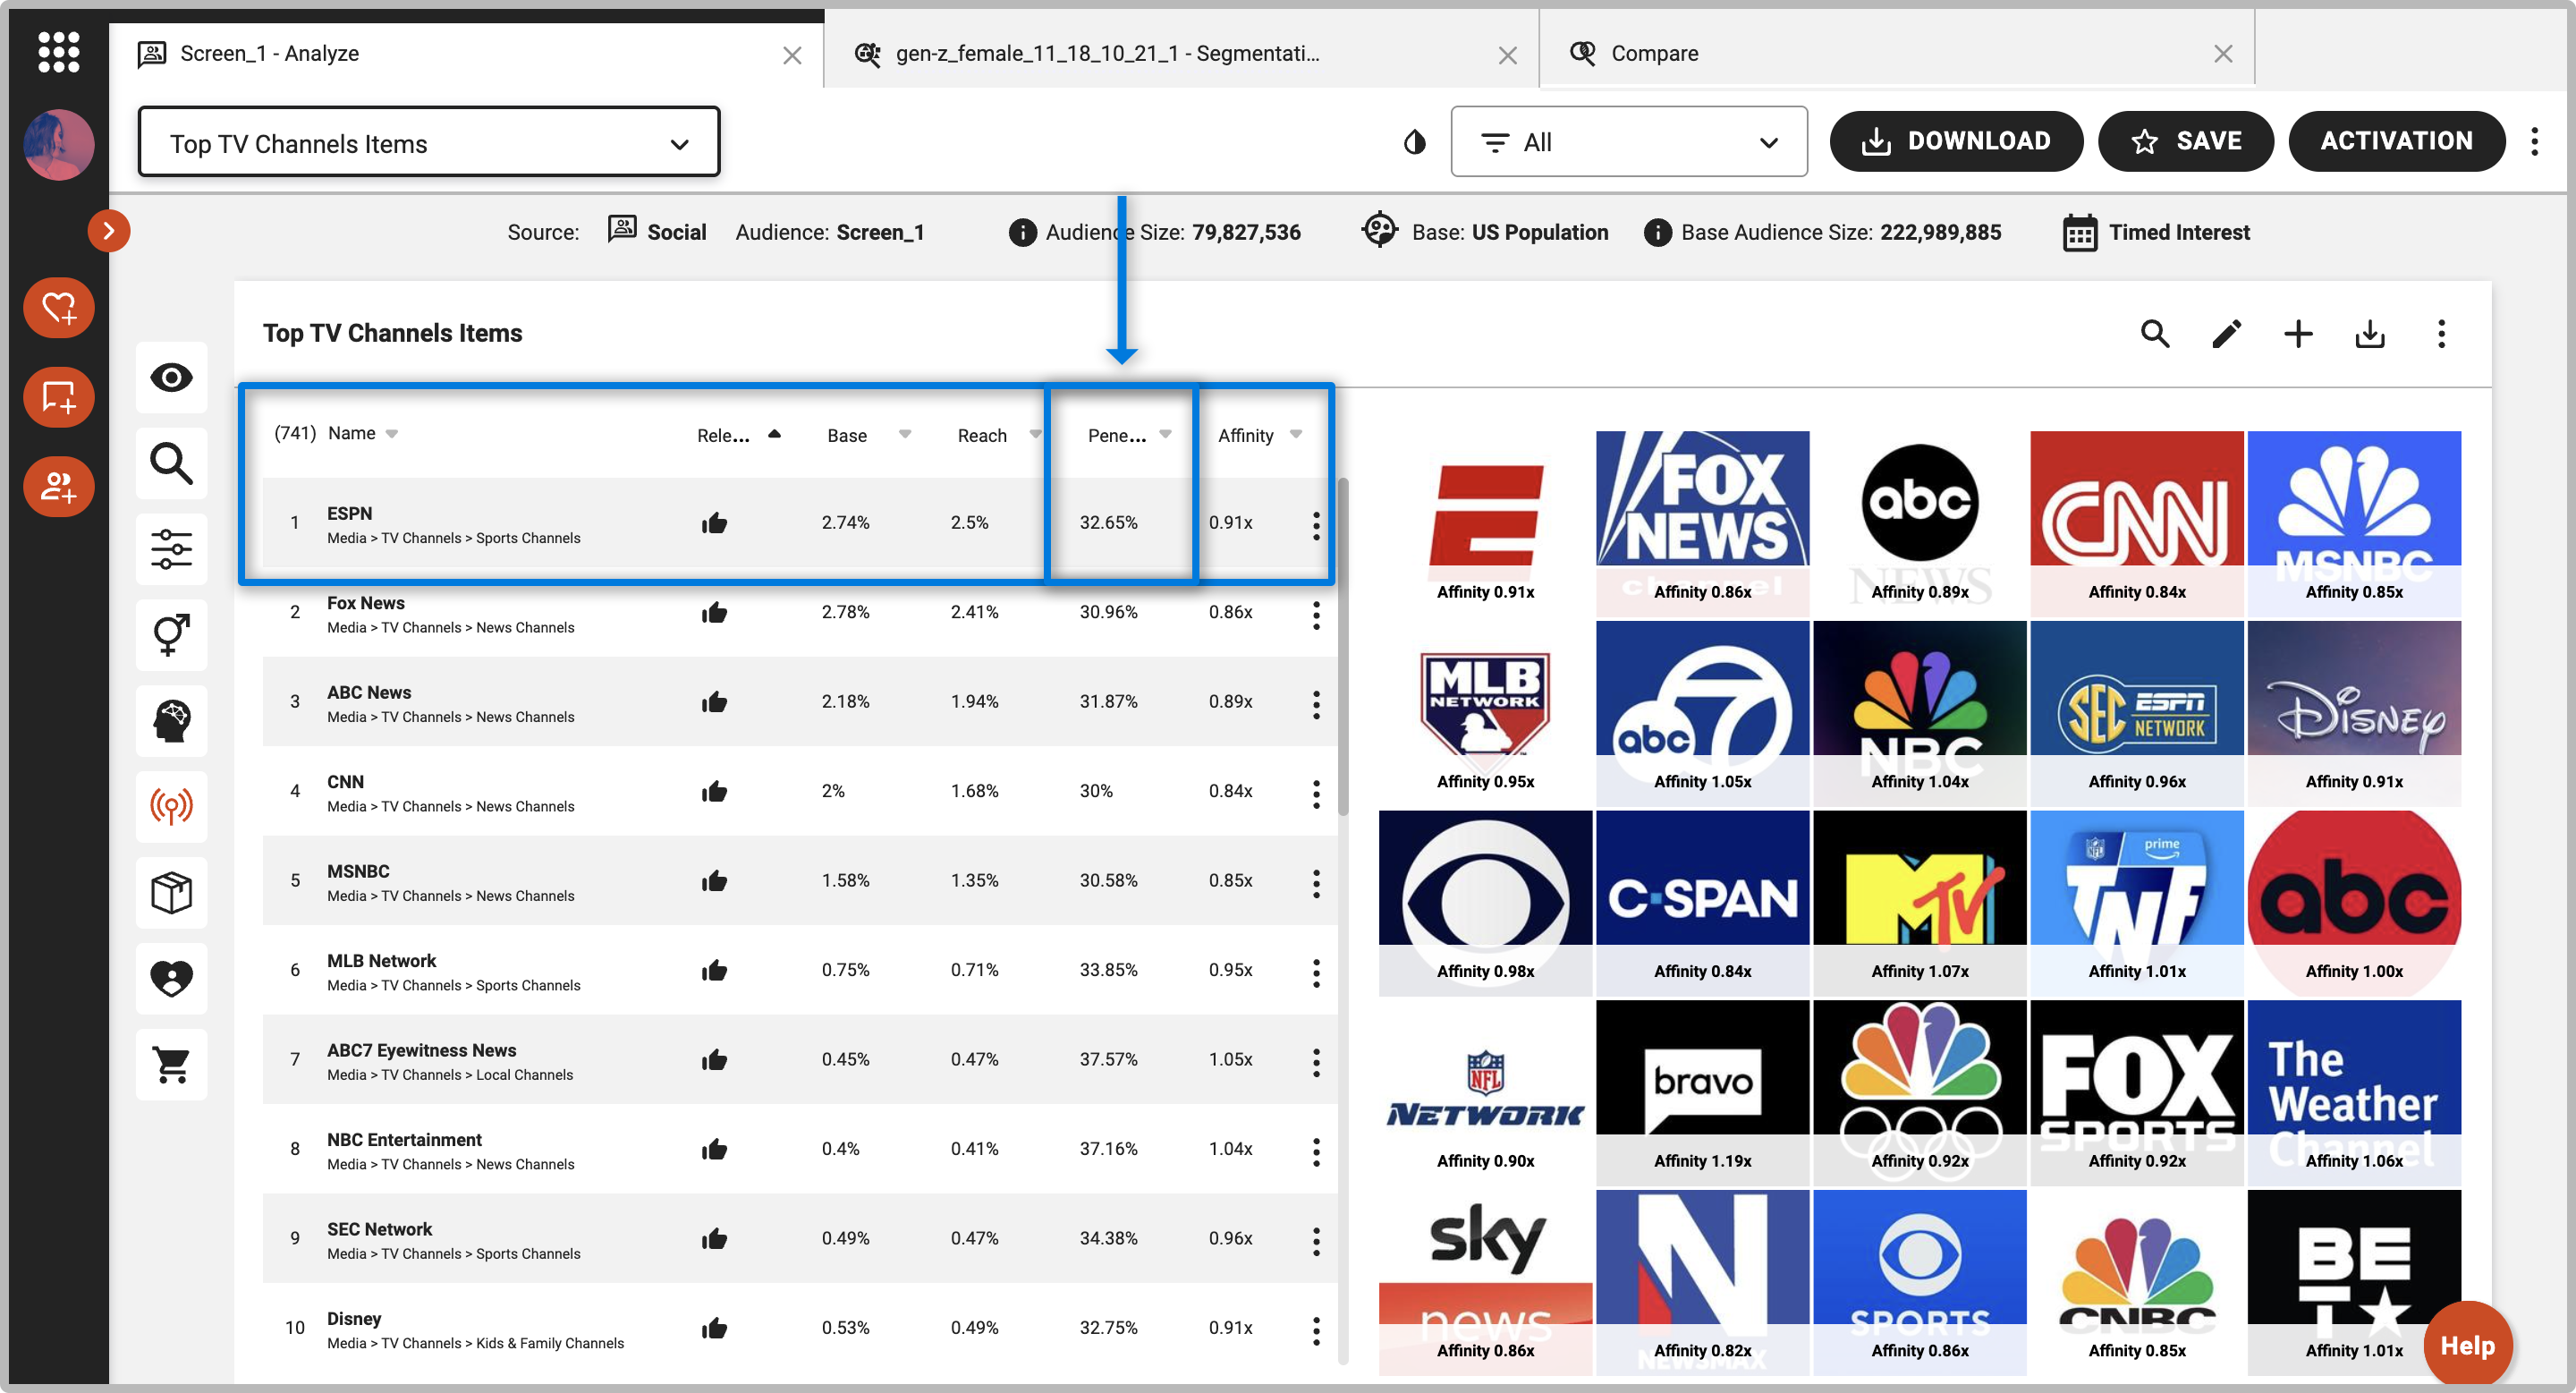
In the above example, you would penetration reach as: 11.74% of those interested in MTV are interested in Chipotle.
Penetration can be used to understand opportunity, particularly when looking at media and influencers. Penetration can tell you what percentage of that media or influencer’s audience is in your queried audience.
Similarly to reach, penetration will vary greatly depending on how niche your audience is, and depending on what category you are looking at. Because of this, there is no minimum or maximum penetration percentage that is considered significant.
Using it in a sentence: ZZ% of [item/product] is interested in [audience]
Base Percentage Definition
The base percentage tells you what percentage of the base population has a specific interest. It is essentially the reach metric but for your base population.
How to Read and Interpret Base Percentage
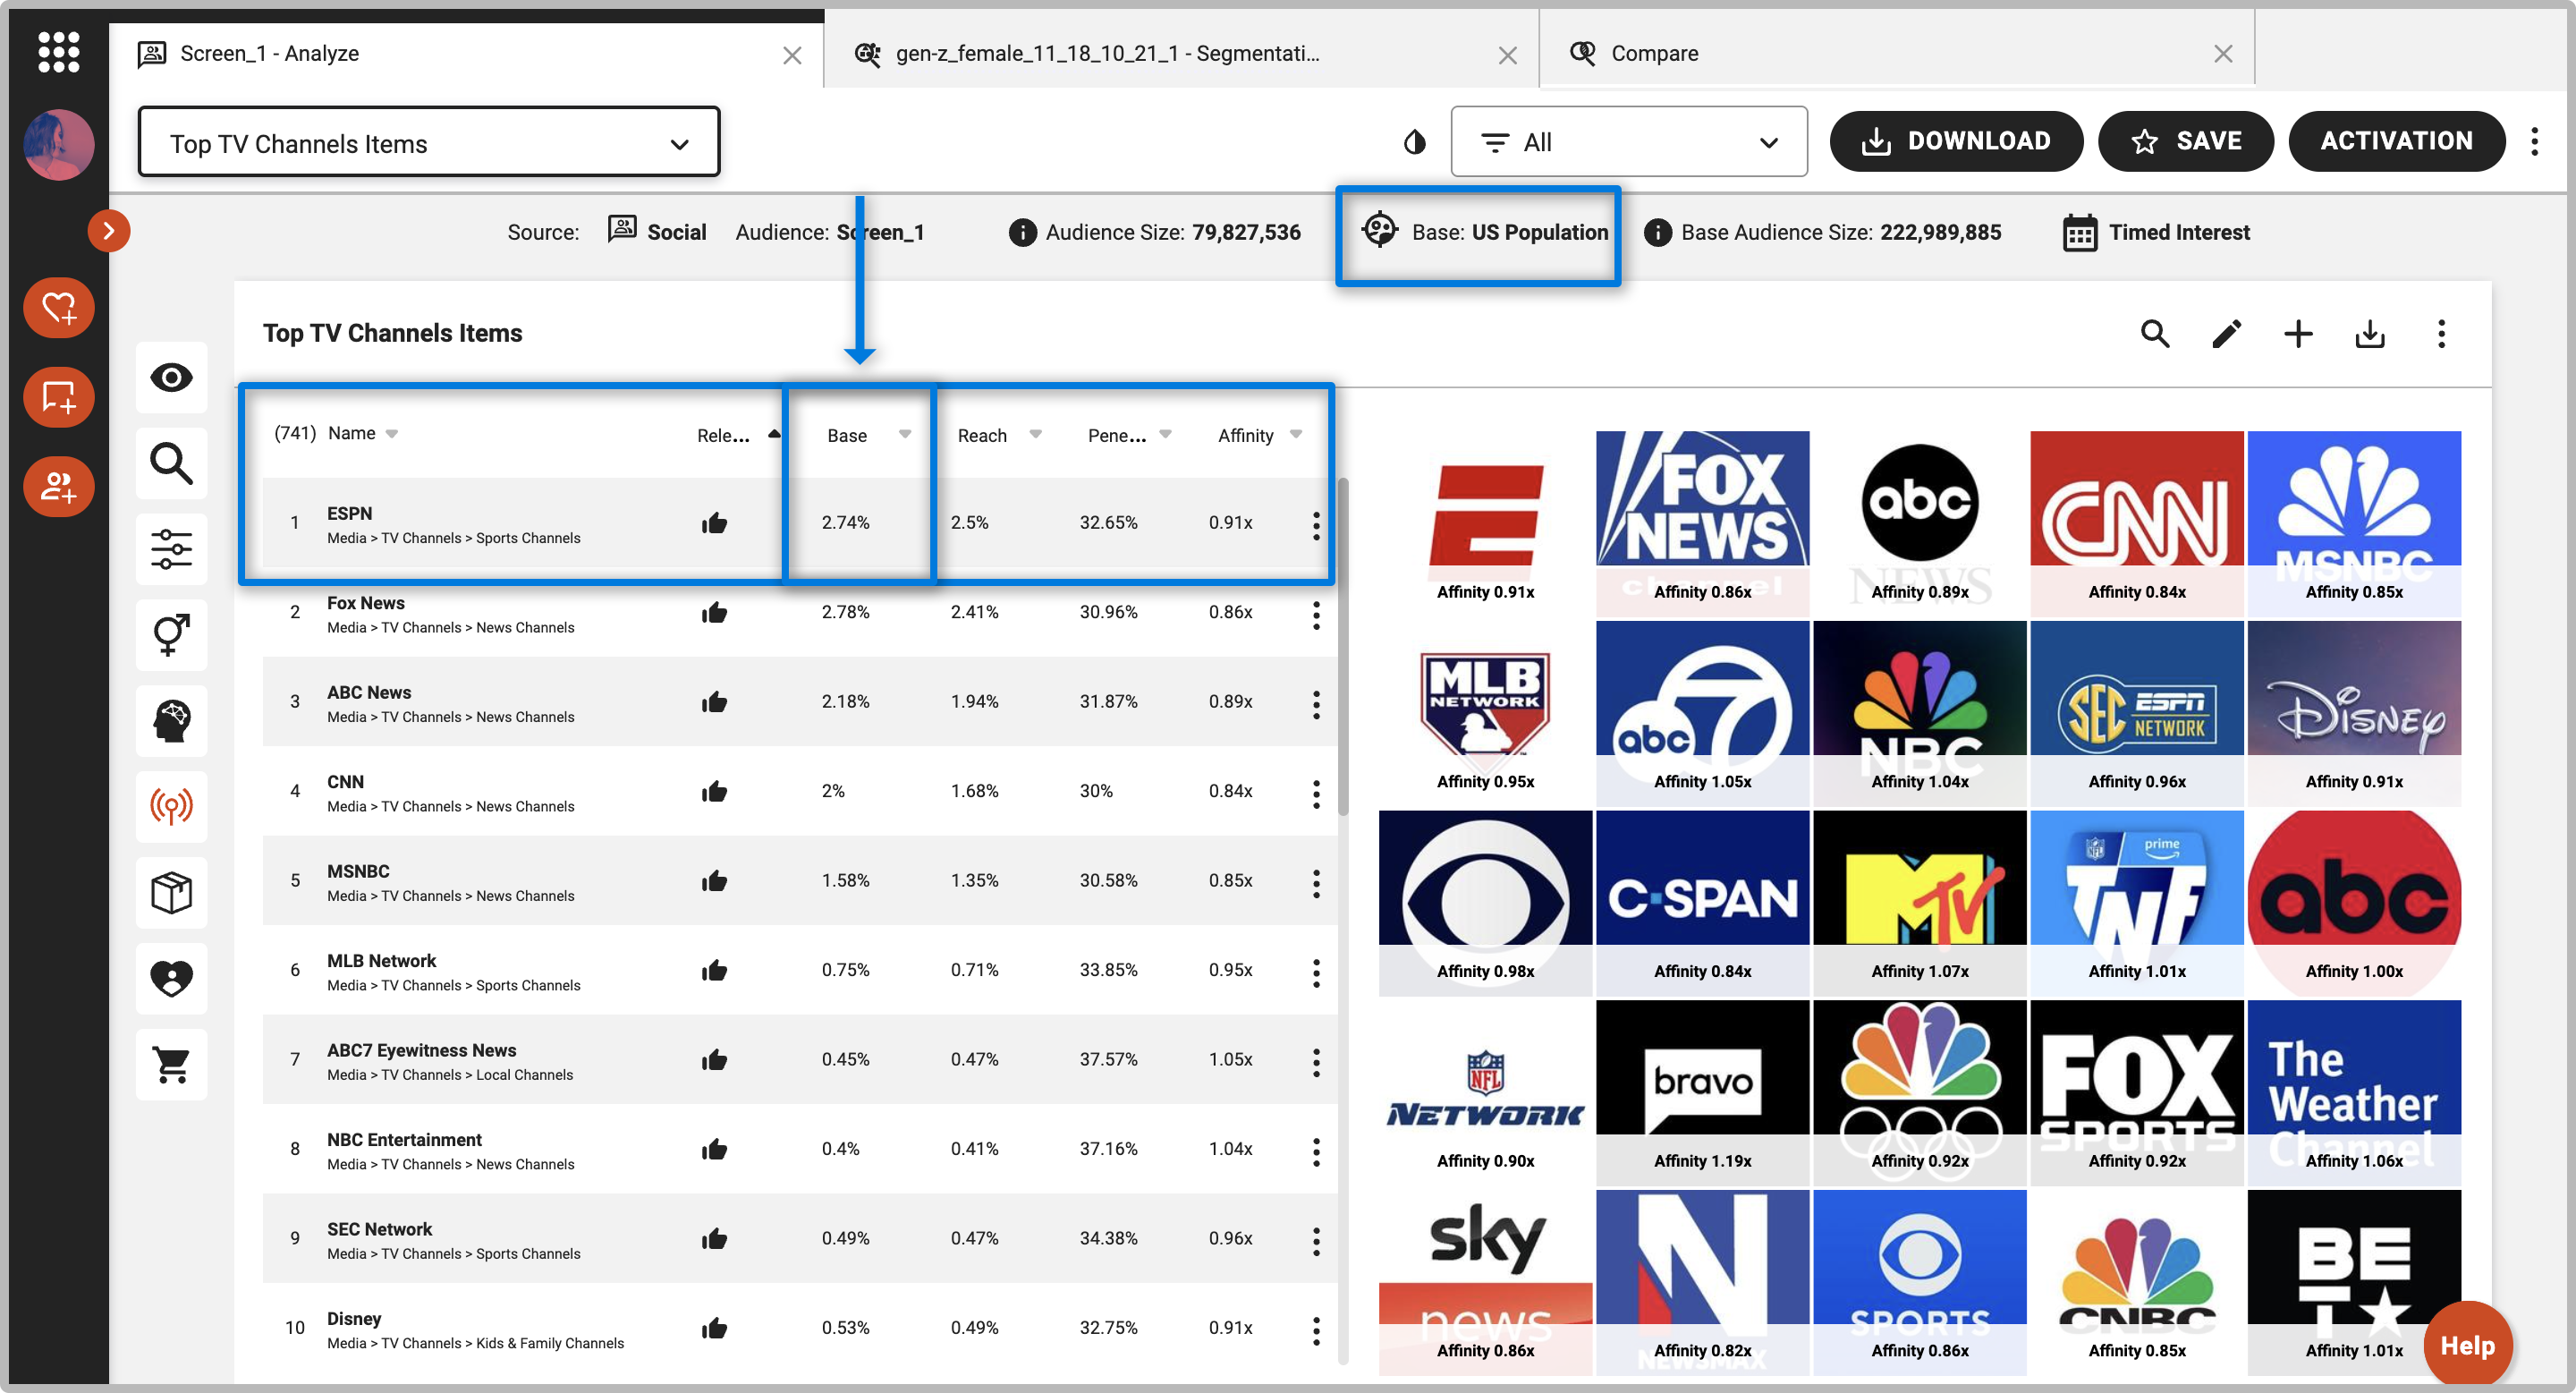
In the above example, you would read base as: 10.98% of the total US population is interested in MTV.
Base percentage can serve as a helpful benchmark to quickly see how many people have a certain interest, lifestyle, or demographic trait on average.
Using it in a sentence: ZZ% of [base population] is interested in [item/product].
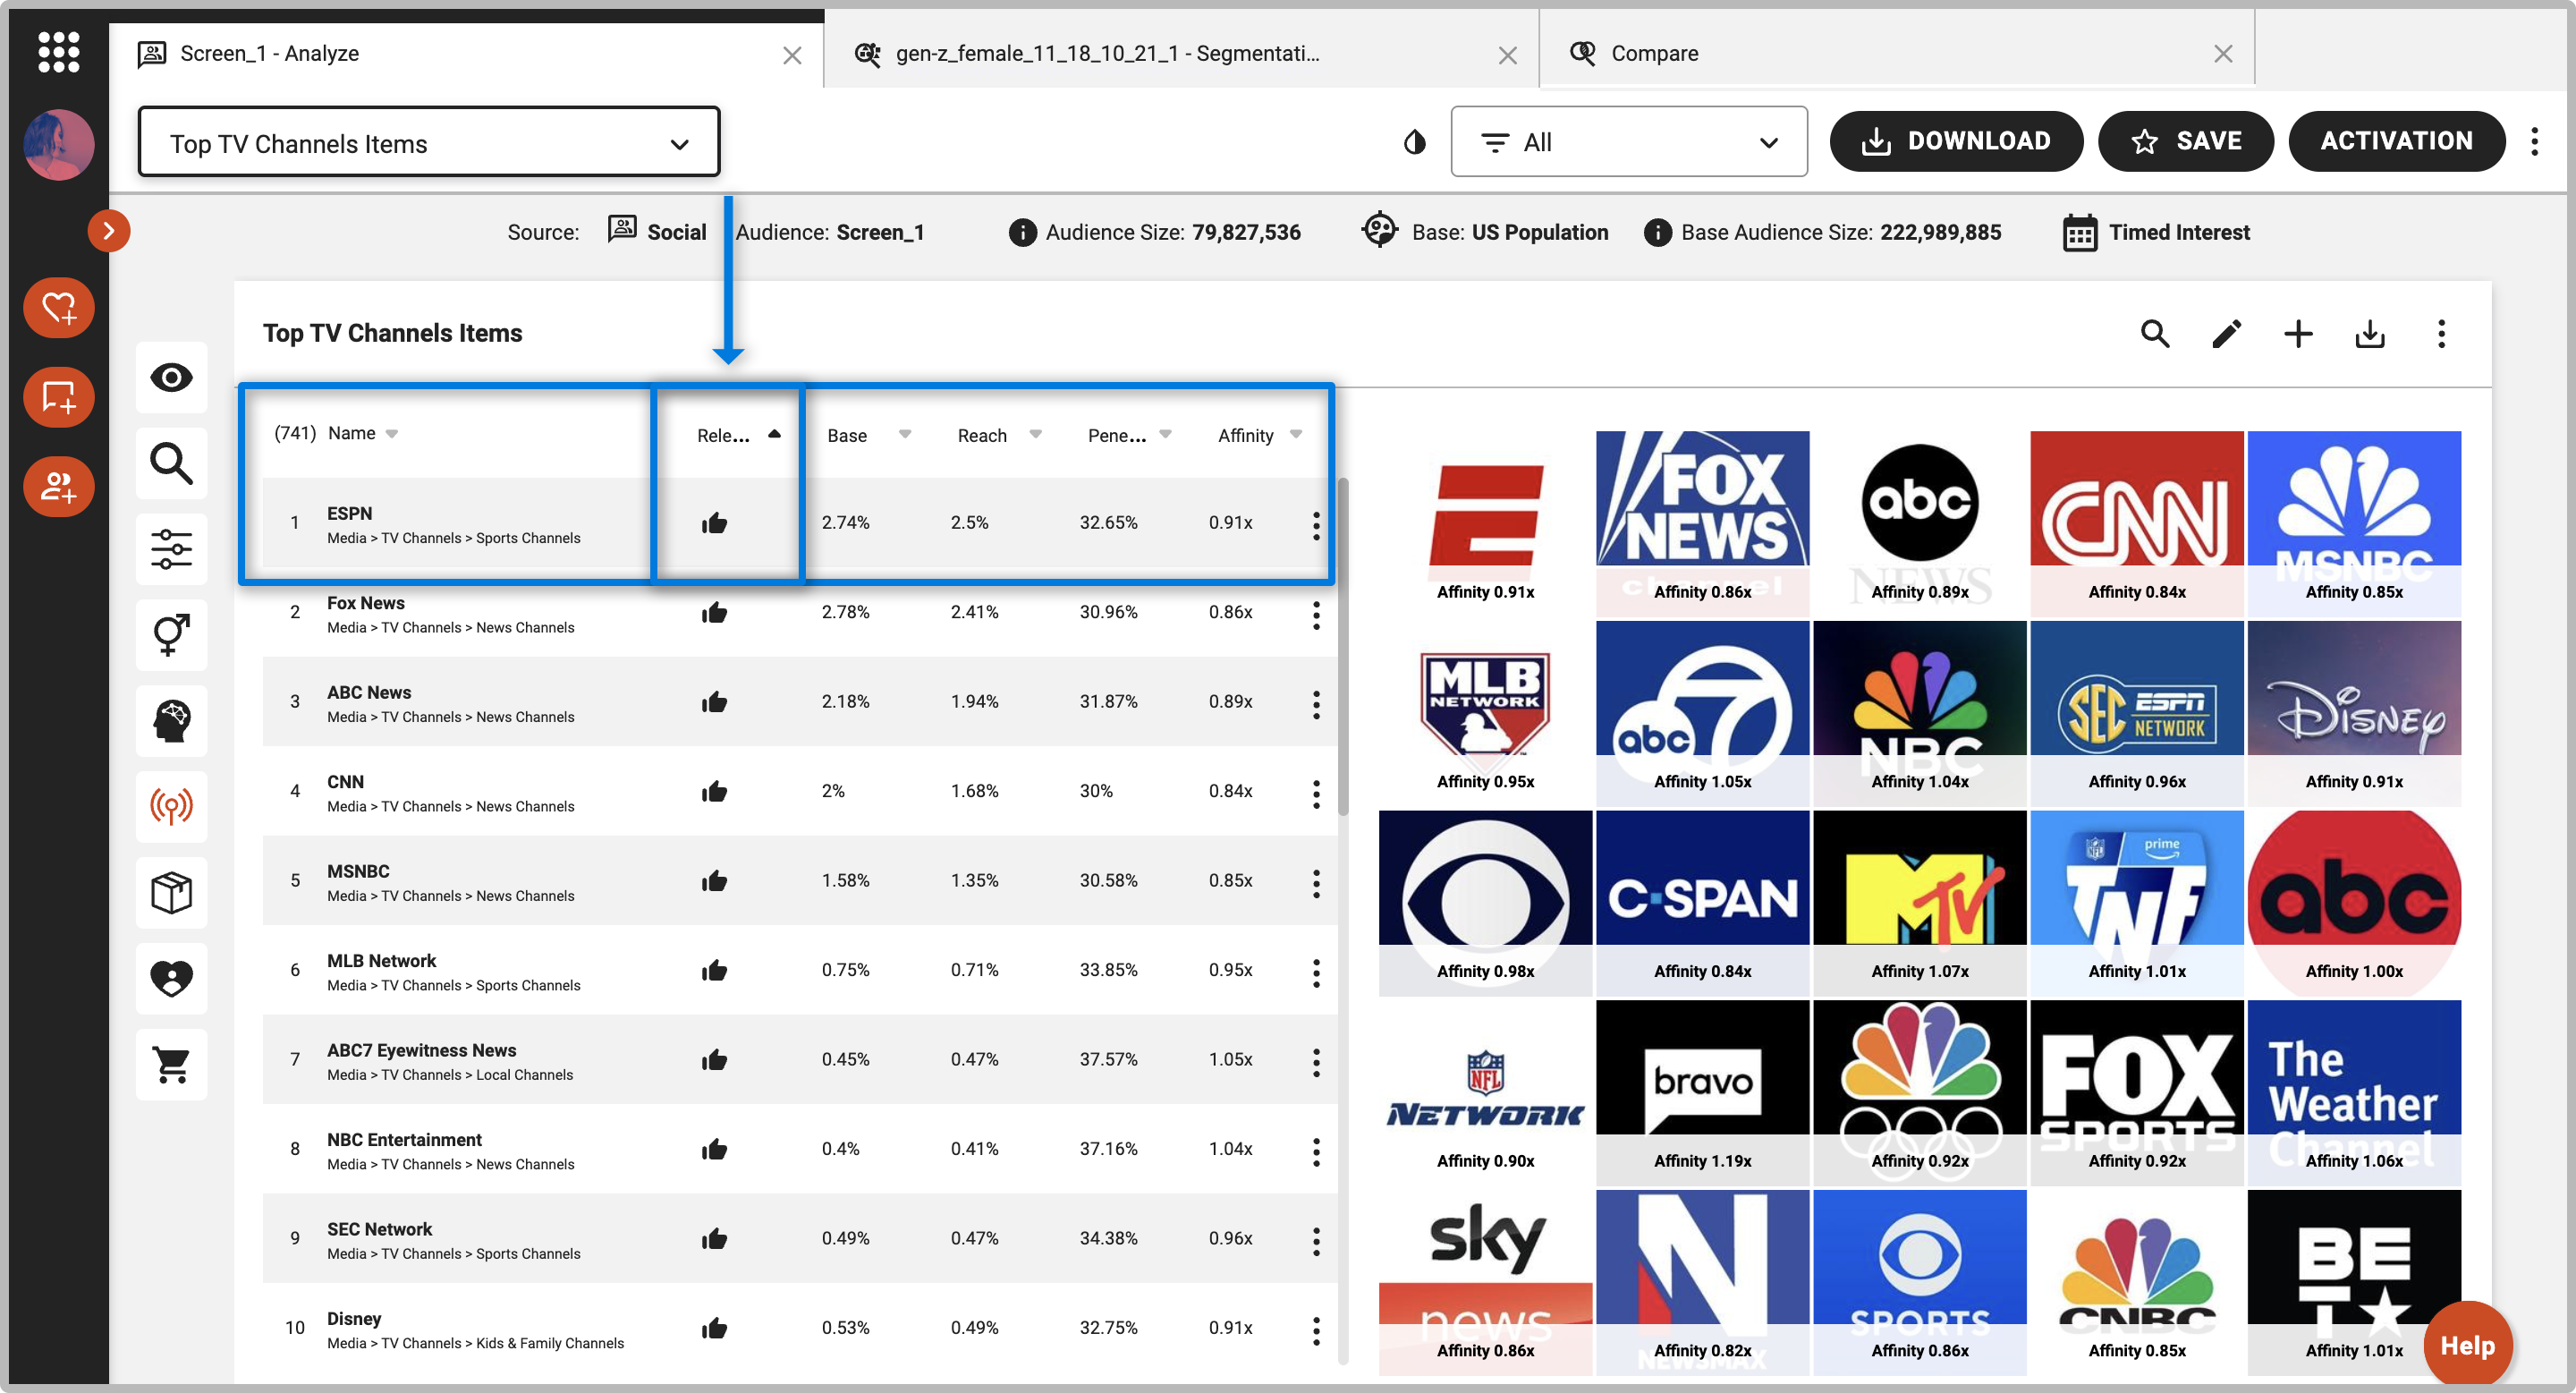
Relevancy Definition
The top 10% most relevant items in the table you are viewing will be indicated with the blue thumbs up icon in Discover. Relevancy indicates that the item has a high combination of both reach and affinity for your queried audience. When you sort a list of items by relevance, the order will be based on the most to least relevant items.
Please note that the items marked as relevant may change if you are looking at a longer or shorter list of items, as it is always the top 10% that are given the thumbs up.
How to Read and Interpret Relevancy
In the above example, you would read relevance as: MTV is relevant to those interested in Chipotle.
Relevancy can help identify topics that may resonate most with your audience, and can be a great way to sort results as it takes both reach and affinity into account. It is also a helpful secondary indicator when you are viewing a table sorted by another metric such as reach, affinity, or penetration.
Using it in a sentence: [item/product] is relevant to [audience].