
Welcome to Explore
Experience instant charting and fast one-click shortcuts.
Introducing Explore. With full SaaS compliance, enhanced reporting and a user-friendly interface, navigating our platform has never been easier. Experience effortless research analysis with intuitive navigation and a fresh new dashboard, all aimed at optimizing your workflow and
maximizing productivity.
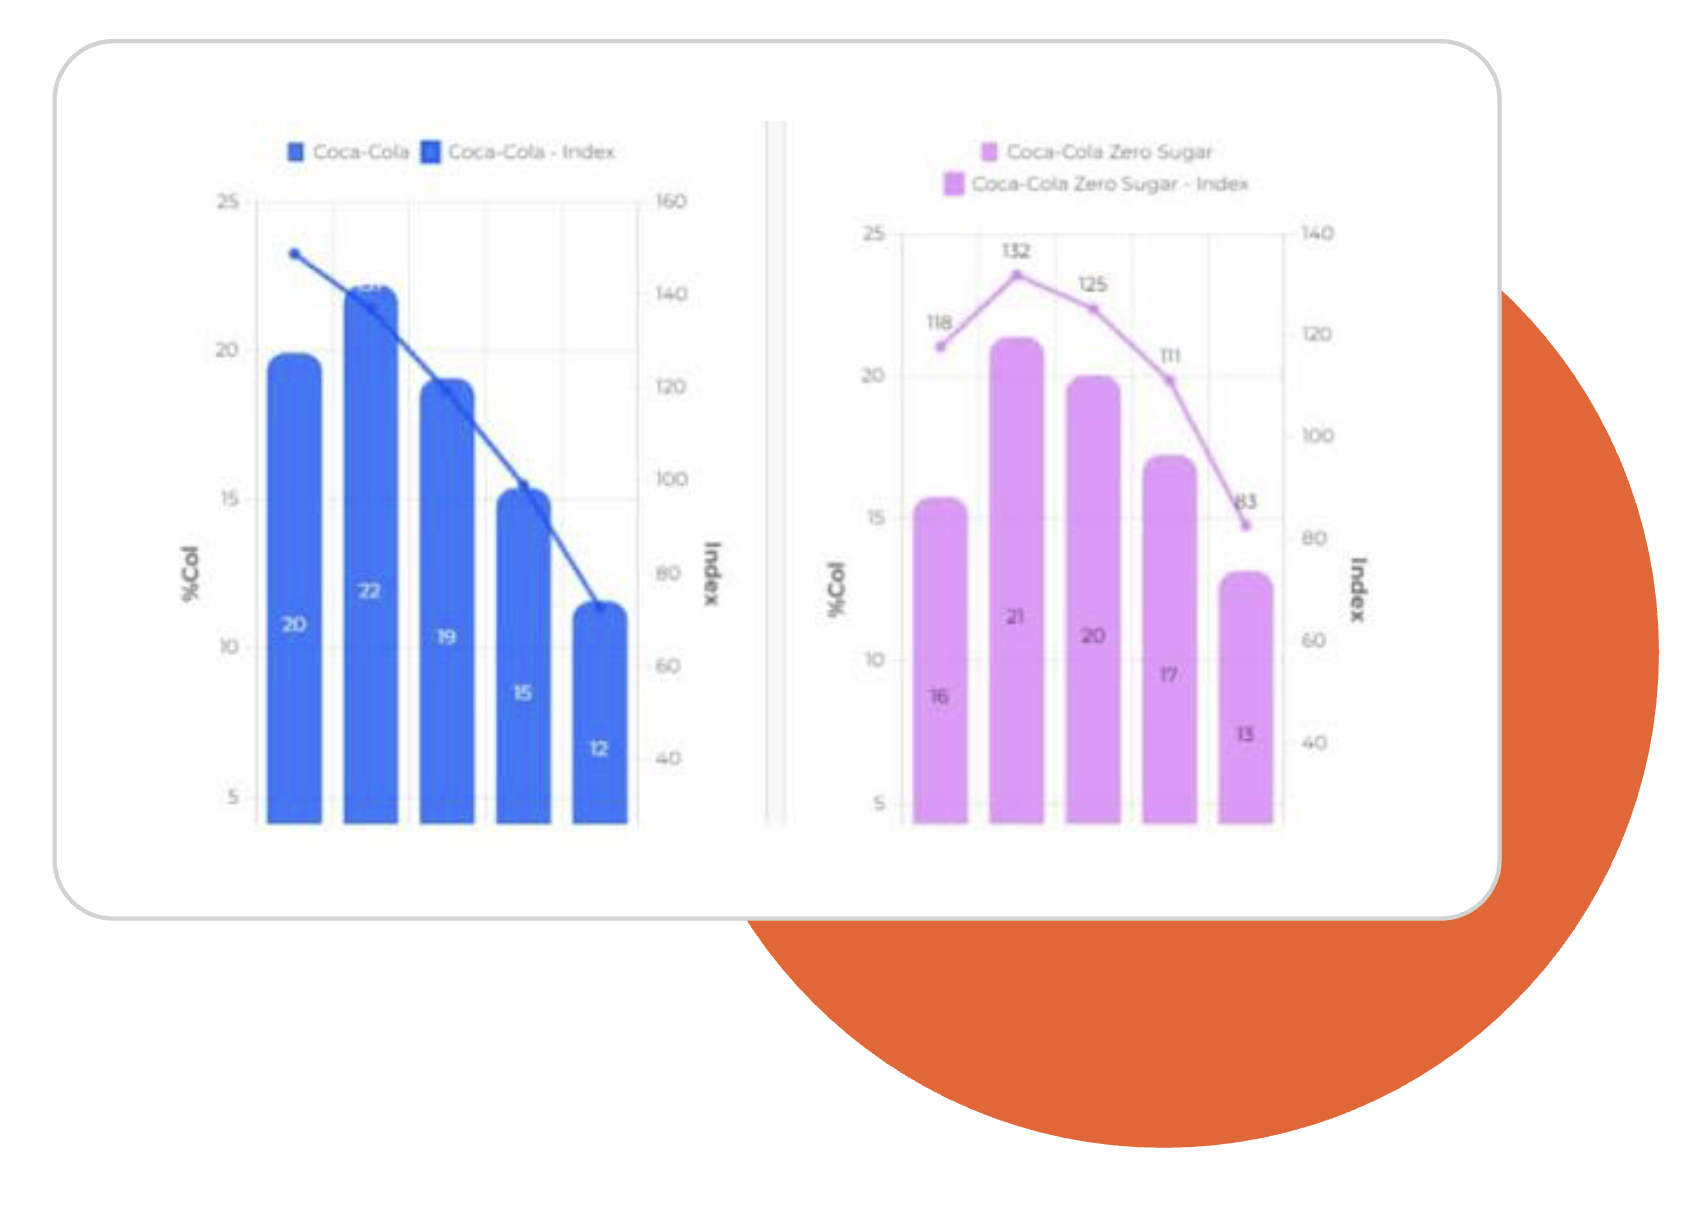
Dynamic Data Visualisations
Only in Explore! Discover the power of dynamic charting with integrated, real-time graphs that automatically reflect data changes, visualizing all your targets in one and streamlining your entire data analysis.
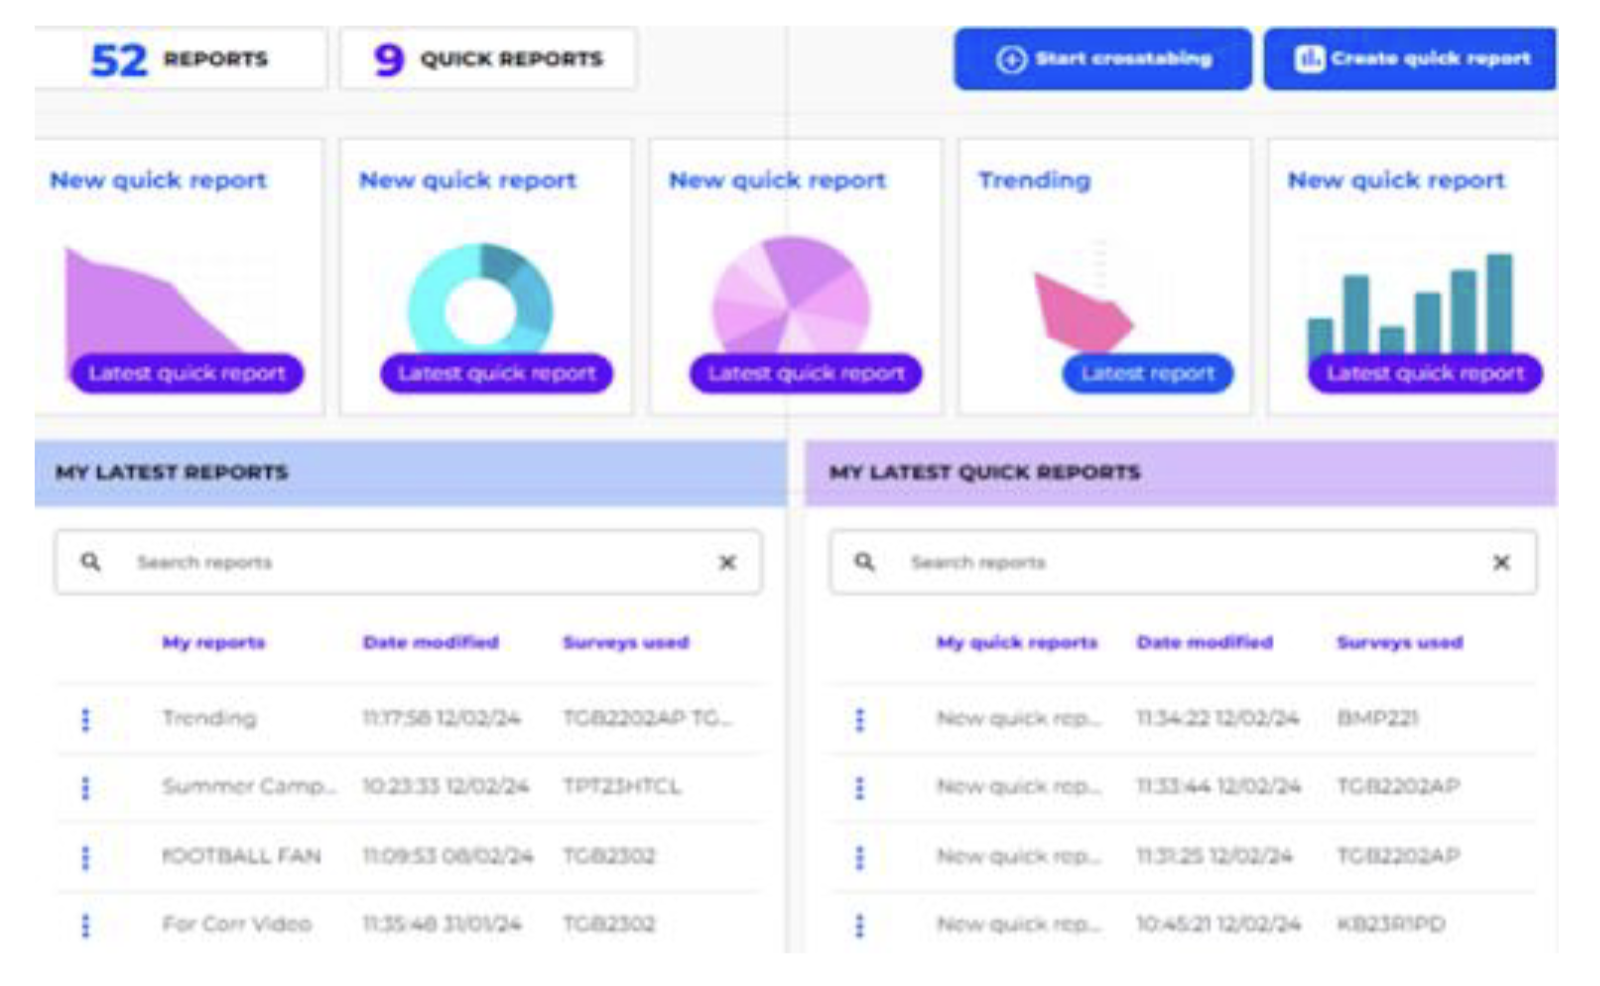
New Dashboard Workflow
Experience the flexibility of streamlined insights management with Explorer's new dashboard. Quickly access your reports in one centralized location and effortlessly colla borate with col leagues or cross functional teams.
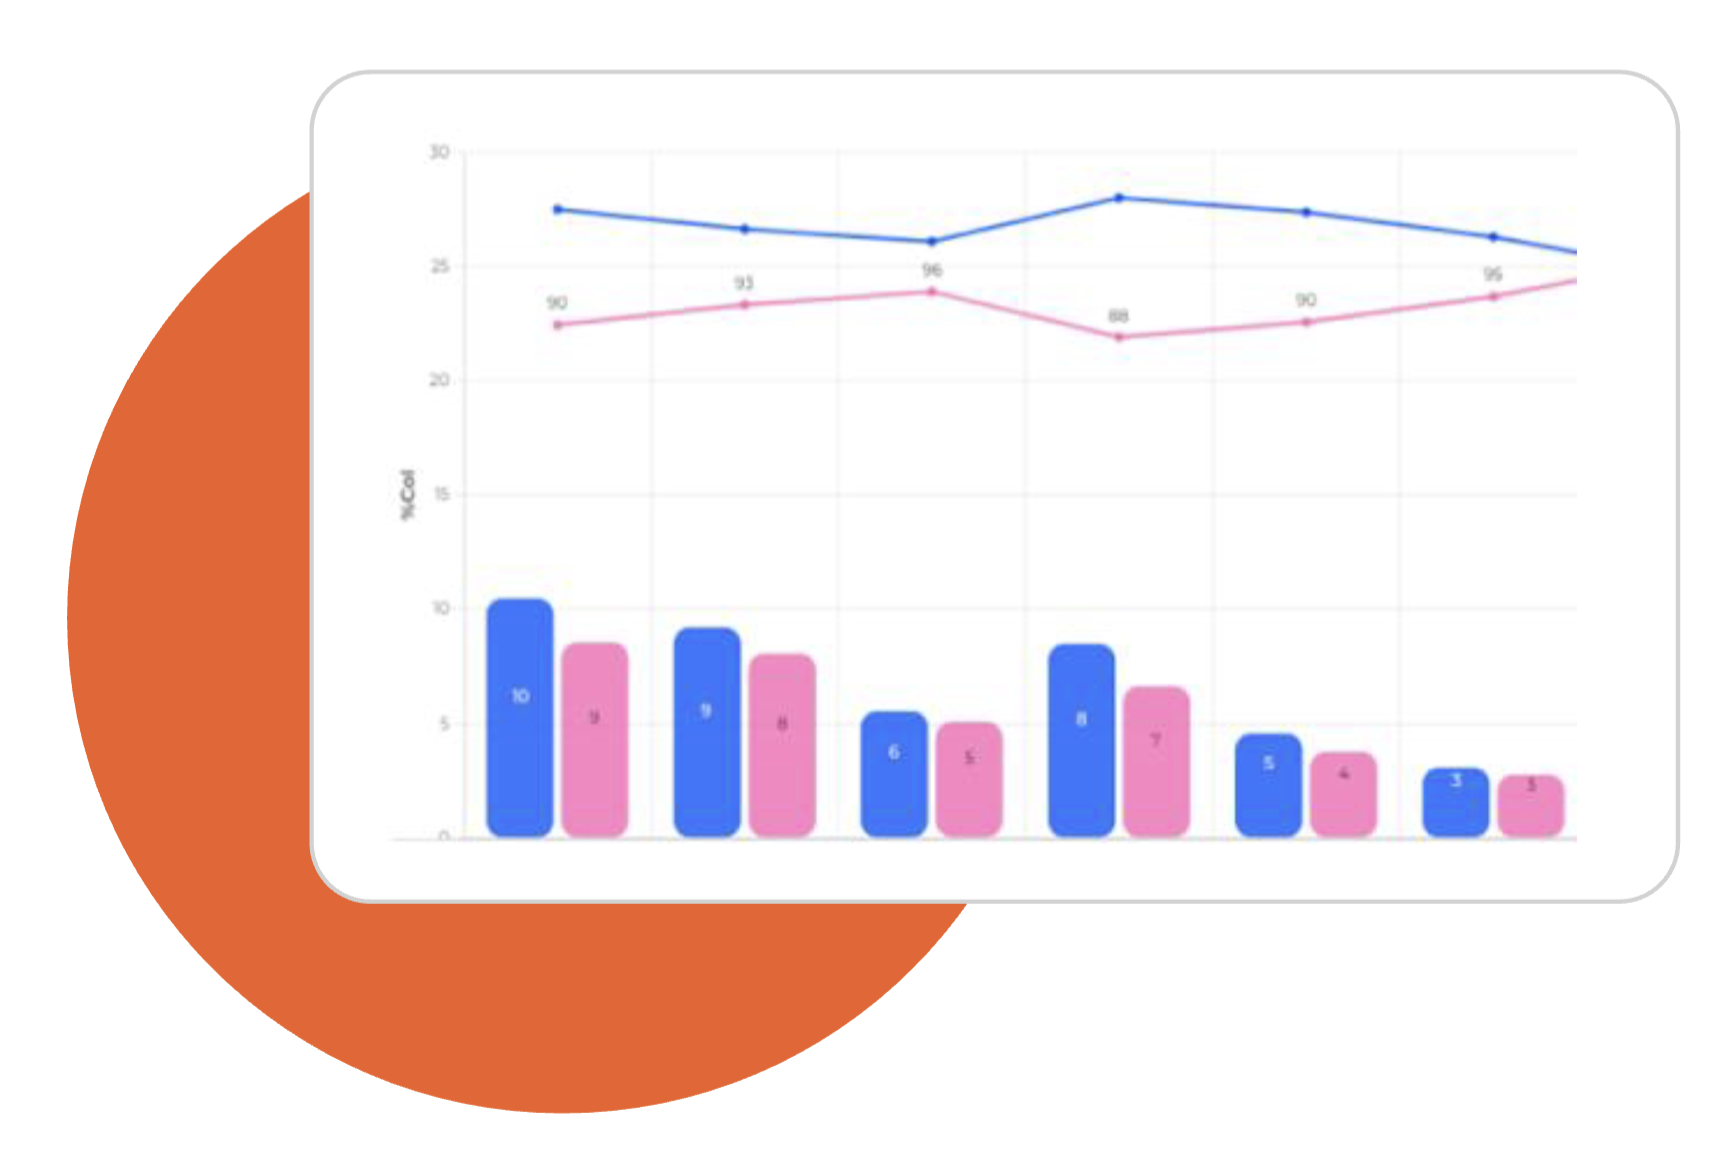
Dynamic Trend Charts
Simplify your trend analysis across surveys using Survey Groups, where single targets and multiple insights from different surveys are visualized in one chart, enabling seamless comparisons of insights.
Collaborative Quick Reports
Streamline data analysis and visualization for rapid insights without manual coding, so you can easily create and share reusa ble reports, while empowering admin users to create company-wide Quick Reports, simplifying the process for entire teams.
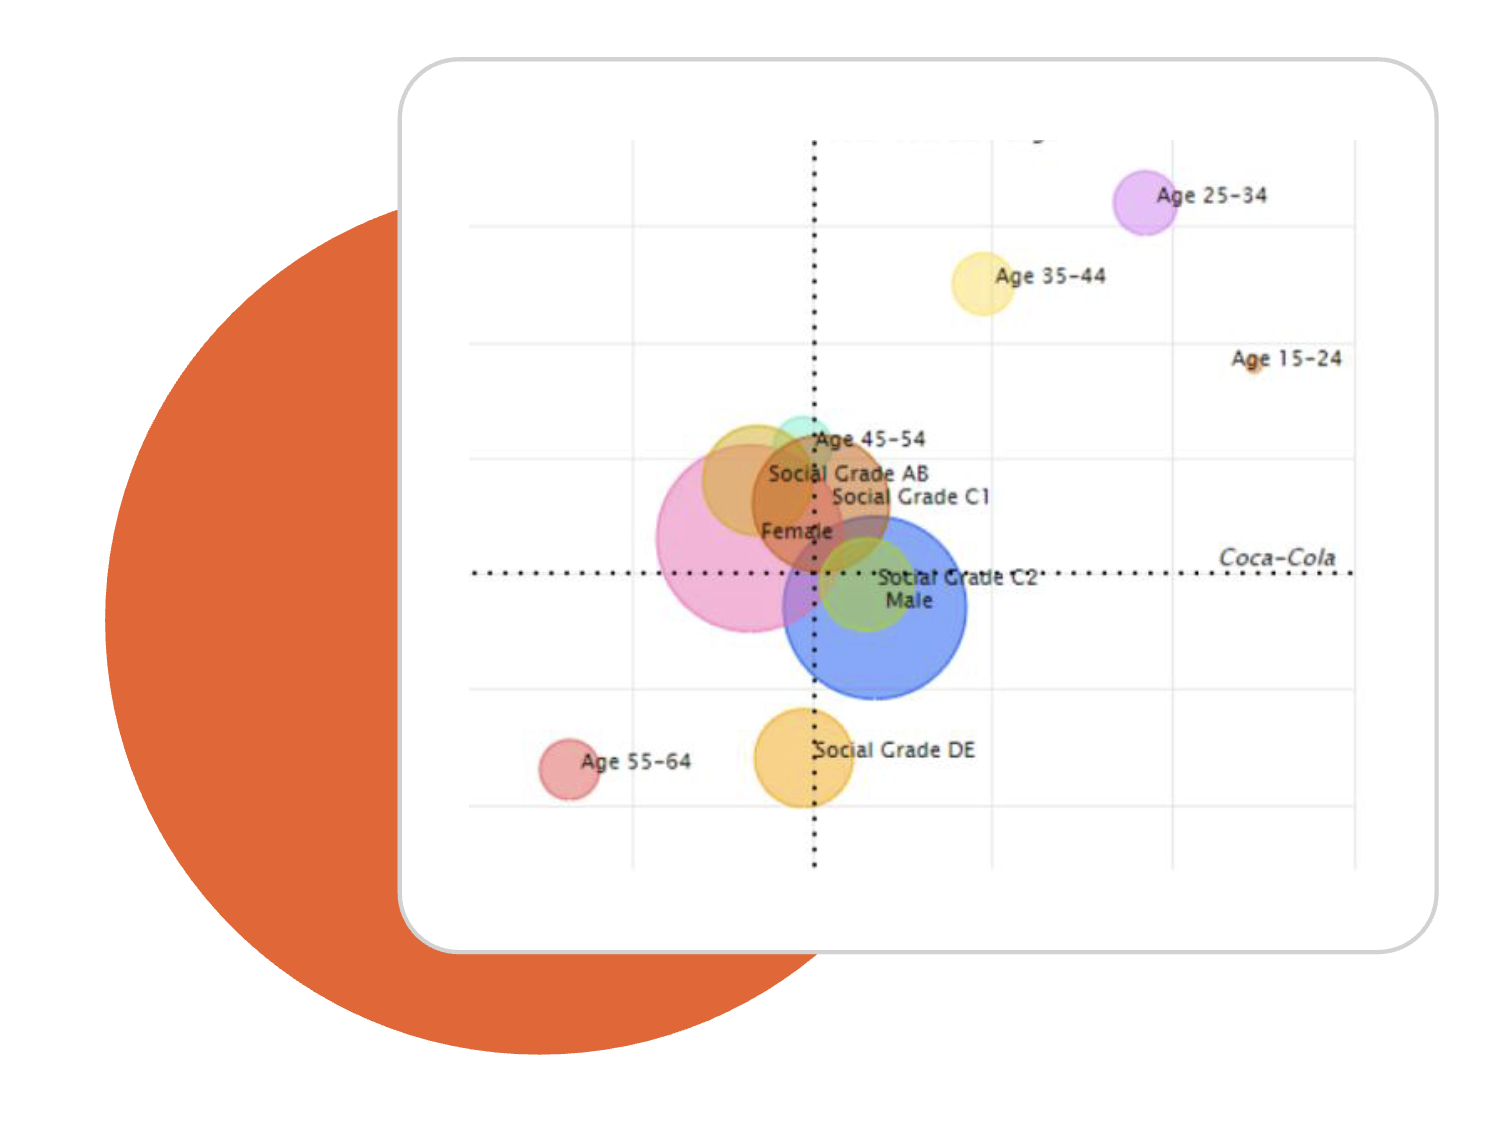
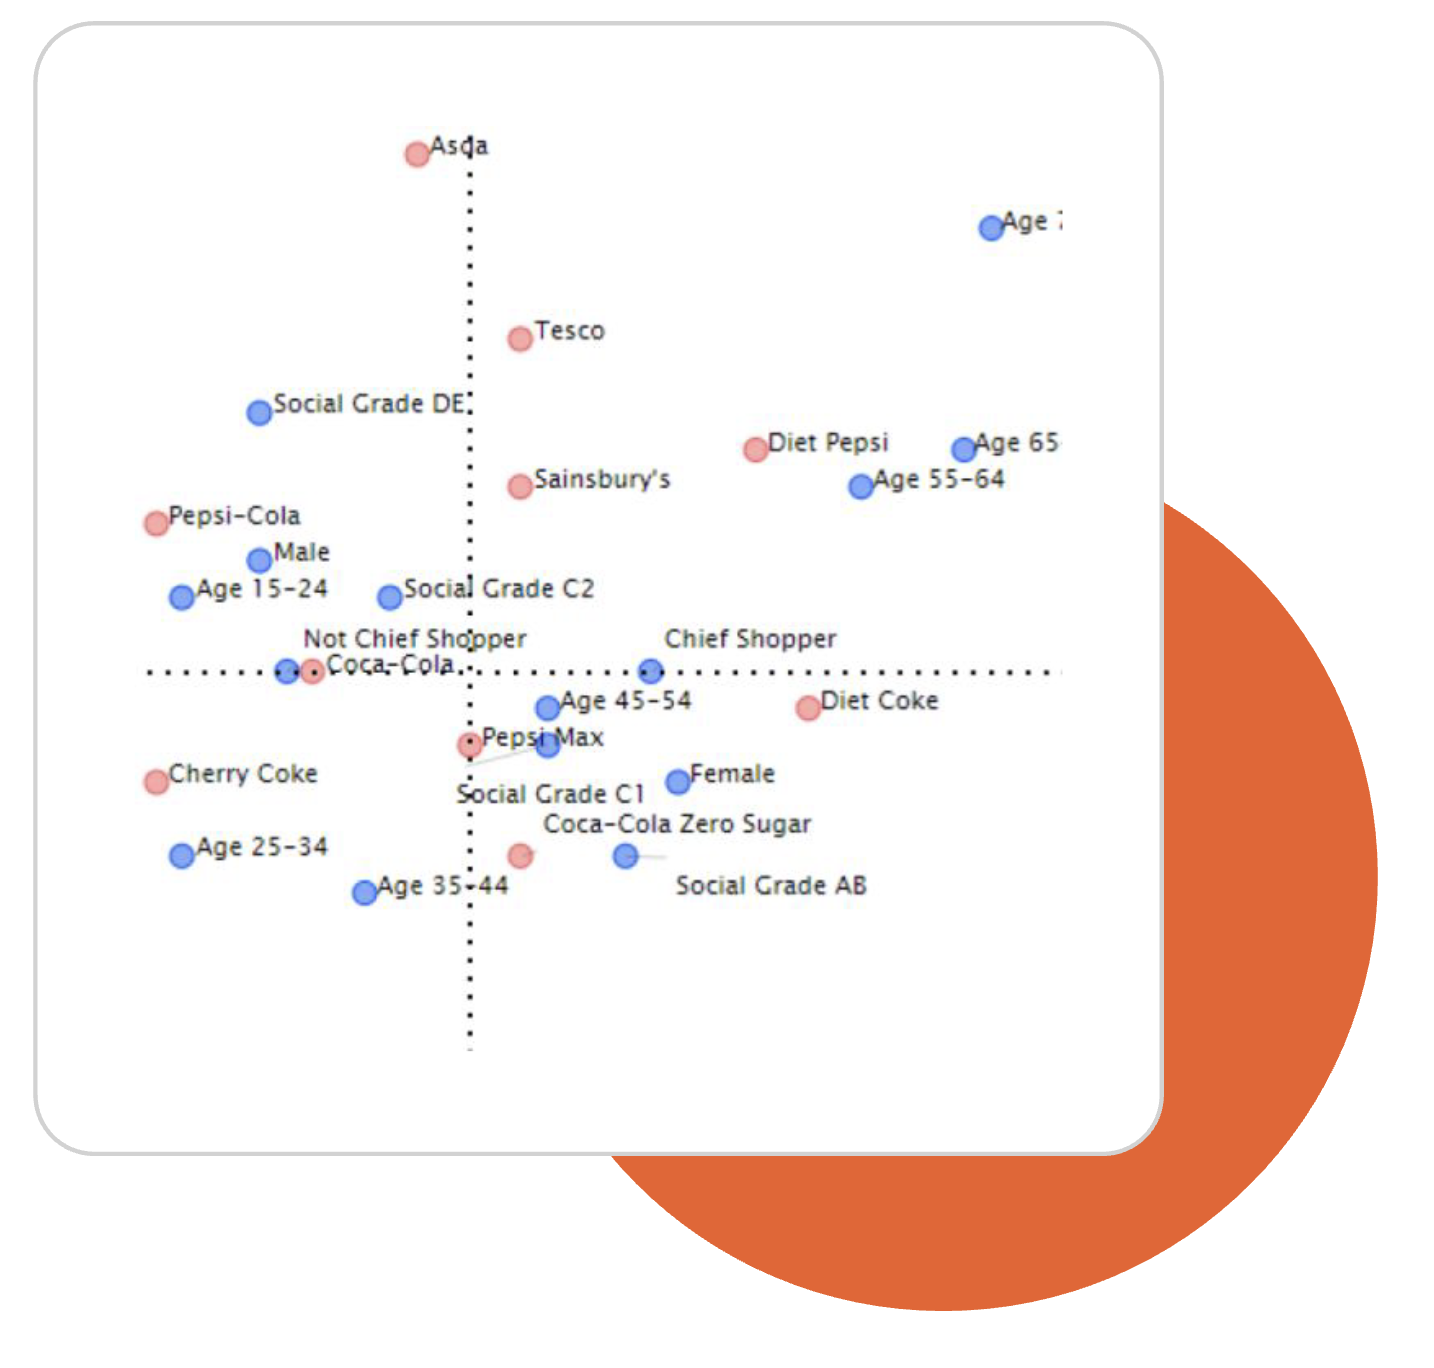
Integrated Positioning Maps
Experience unparalleled convenience and efficiency with the newly enhanced, seamlessly integrated, and highly customizable PMaps, empowering you to effortlessly gain deep insights into customer perception and brand positioning.
One Click Statistics
Access multiple statistical packages integrated seamlessly into Explore with just one click, simplifying intricate analyses to identify market
gaps, unearth consumer profiles, find unique audience groups and determine brand positions relative to competitors.
- Audience Effects
Analyzes a comprehensive set of variables to identify the most relevant audience segments, based on index and reach, for optimized targeted advertising. - Factor Analysis
Reduces a large set of varia bles by consolidating common patterns into a smaller number of underlying factors or groups. - Cluster
A technique which groups respondents together so that they are the most similar (Internally homogeneous) within their cluster group but as different (Externally heterogeneous) as possible between each cluster group. - Correspondence
A statistical technique used to analyze and visualize the relationships between categorical variables in a contingency table. This method
helps to simplify complex data sets by displaying them in a two-dimensional graph, making it easier to identify patterns and associations among the variables.
Platform Interoperability
Instantly export audience definitions from Explore to Plan for optimal insights and planning efficiency.