How to Segment Audiences in Discover
Discover’s segmentation divides your target audience into interest-based clusters in just a few seconds. Whether you’re creating a buyer persona or exploring new consumer segments to go after, our segmentation tool provides deeper insights into your target audience. After all, when you’re studying a large target audience— like millennials who love video games—you’re really looking at many unique individuals with different interests and passion points.
When to Use Segmentation
Discover’s segmentation can be used when you are looking to break a larger audience into smaller groups, for a variety of reasons. Segmentation works particularly well on larger audiences, or audiences with very diverse interests. For example, segmenting hispanic females or gen Z music fans.
- Segmentation can help you identify the specific sub-groups and smaller, more niche communities which can be hidden when looking at a large audience in aggregate.
- It can help identify white space opportunities, and uncover underserved audiences and show you how best to nurture and grow those groups.
- It can also be very helpful when researching for media campaigns, as it allows you to shape out the groups for very targeted creative and media placements.
Discover Segmentation Methodology
The Discover platform uses k-means clustering analysis to group users who share similar interests (e.g., hair care, fast food, crime TV shows), so that people who like the same things will appear in the same clusters.
How to Segment Audiences
- Build a query for the audience you would like to segment in the Discover platform.
- Click “Run the Query” and select Segmentation.
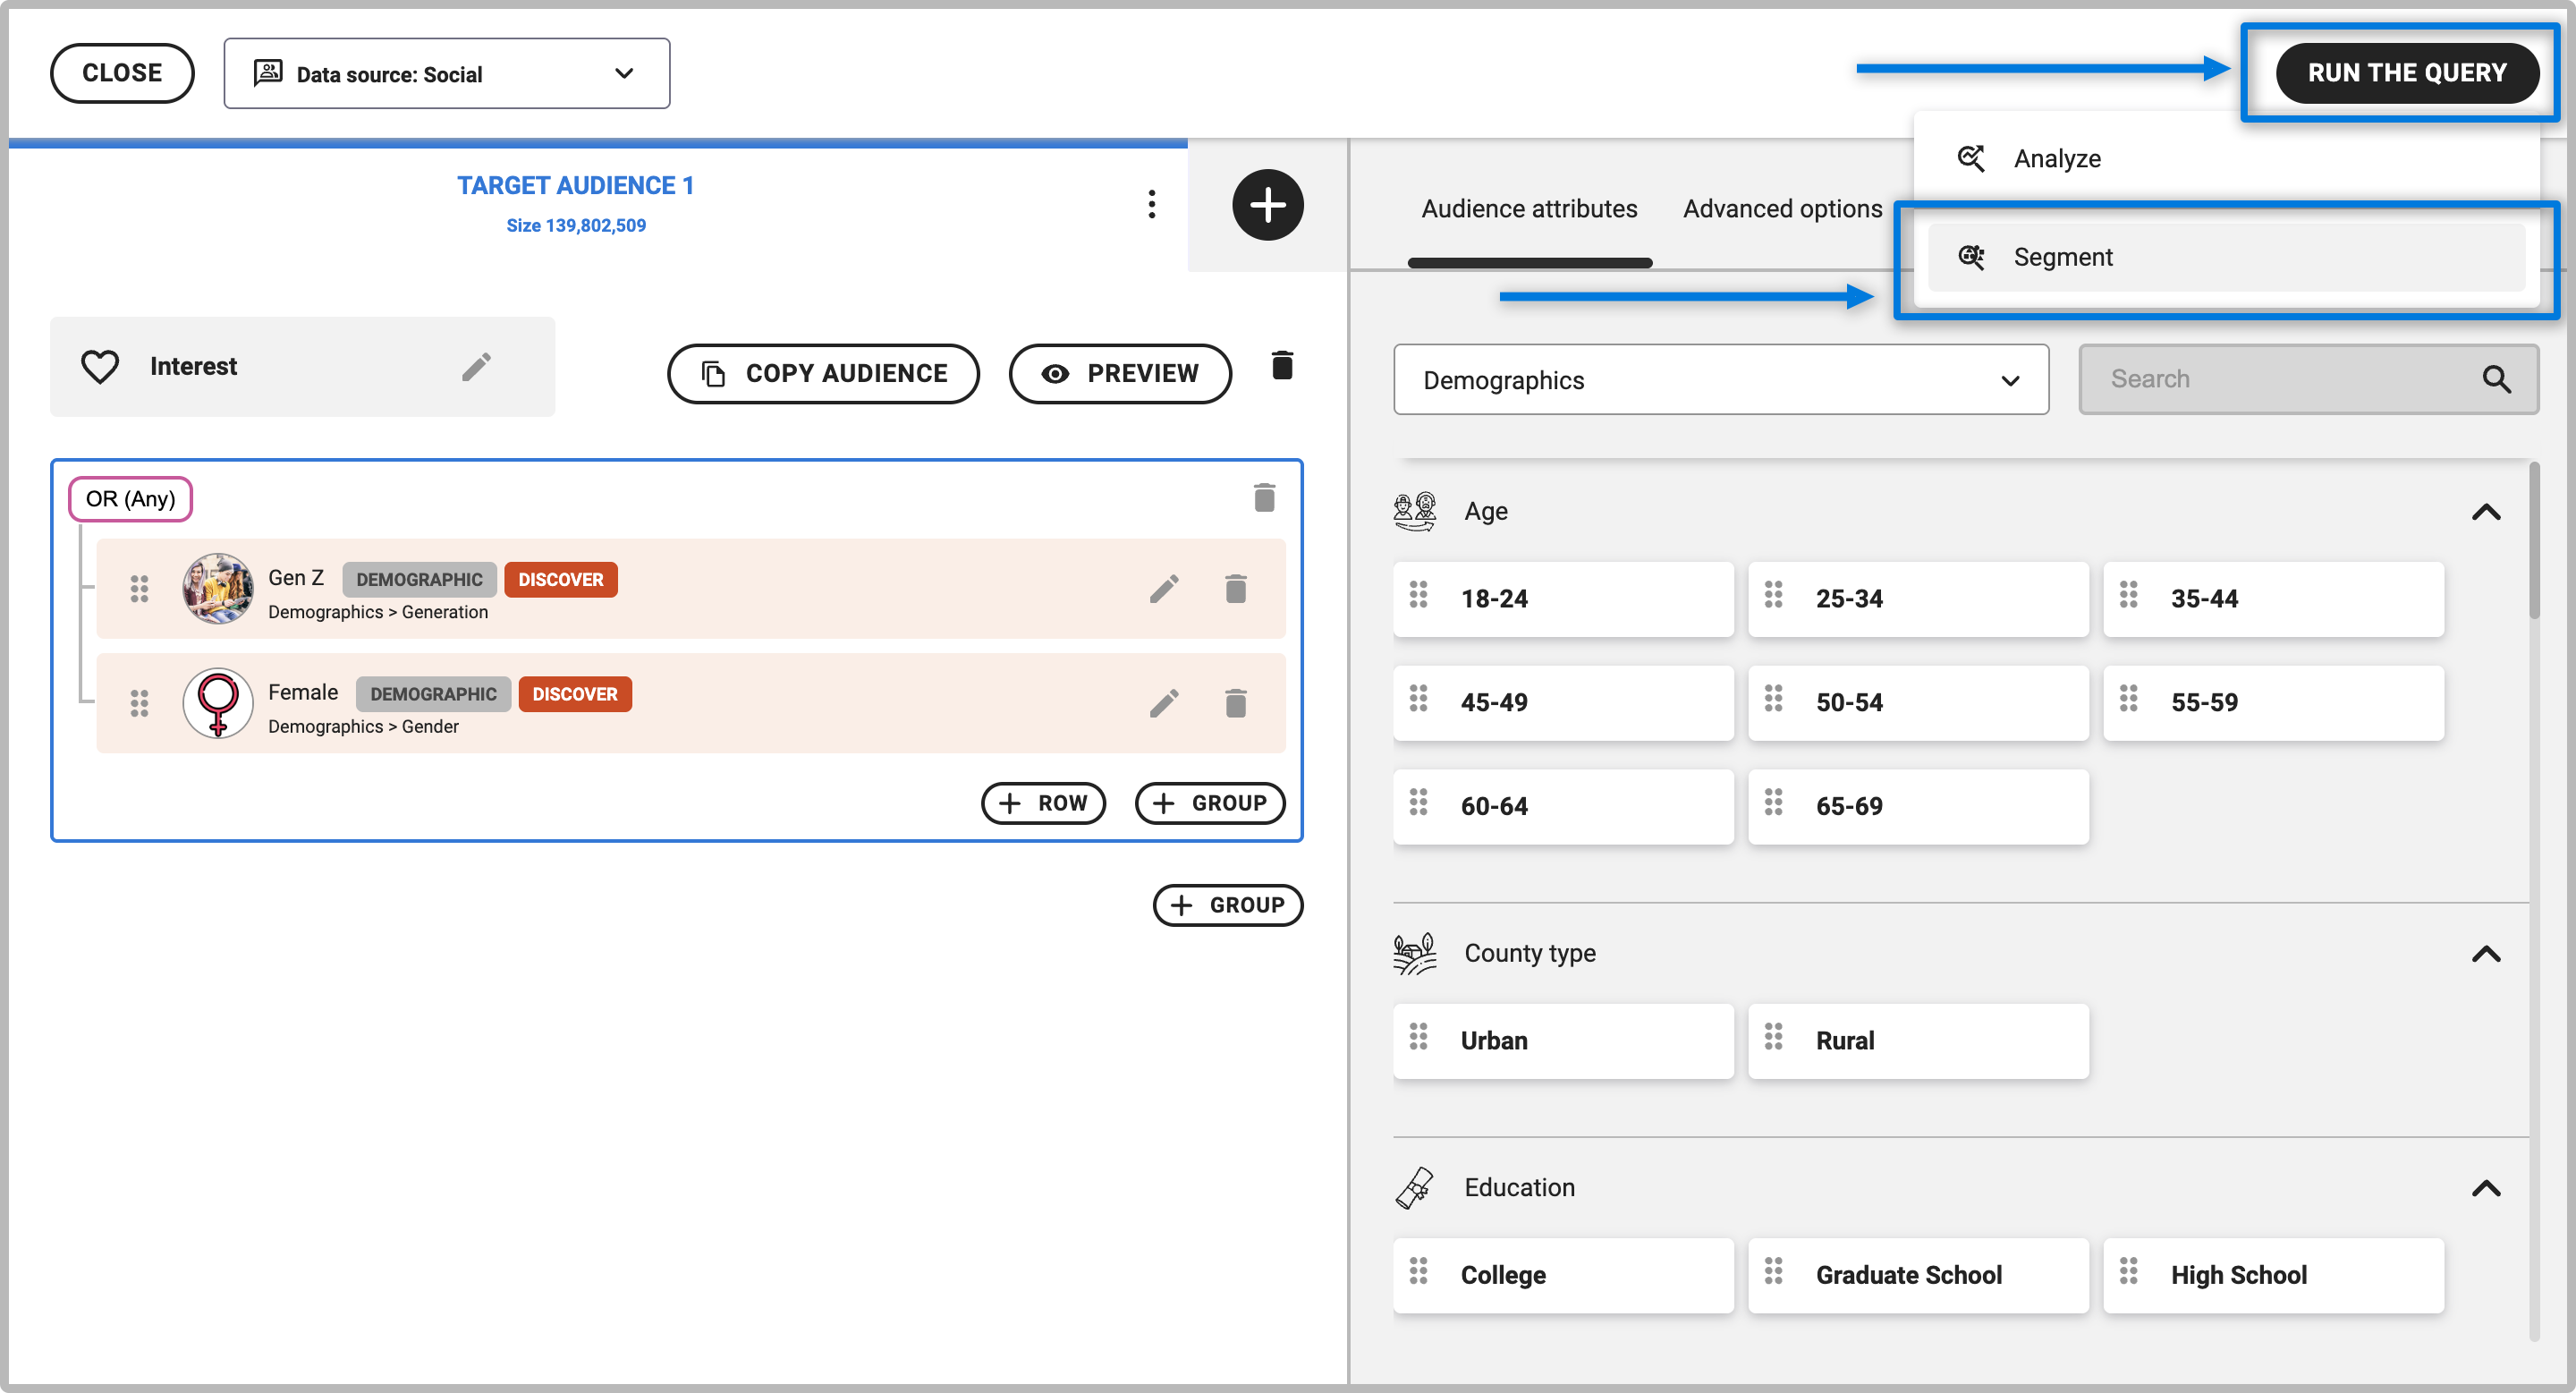
- By default, Discover will identify the number of segments in order to form the most distinct clusters.
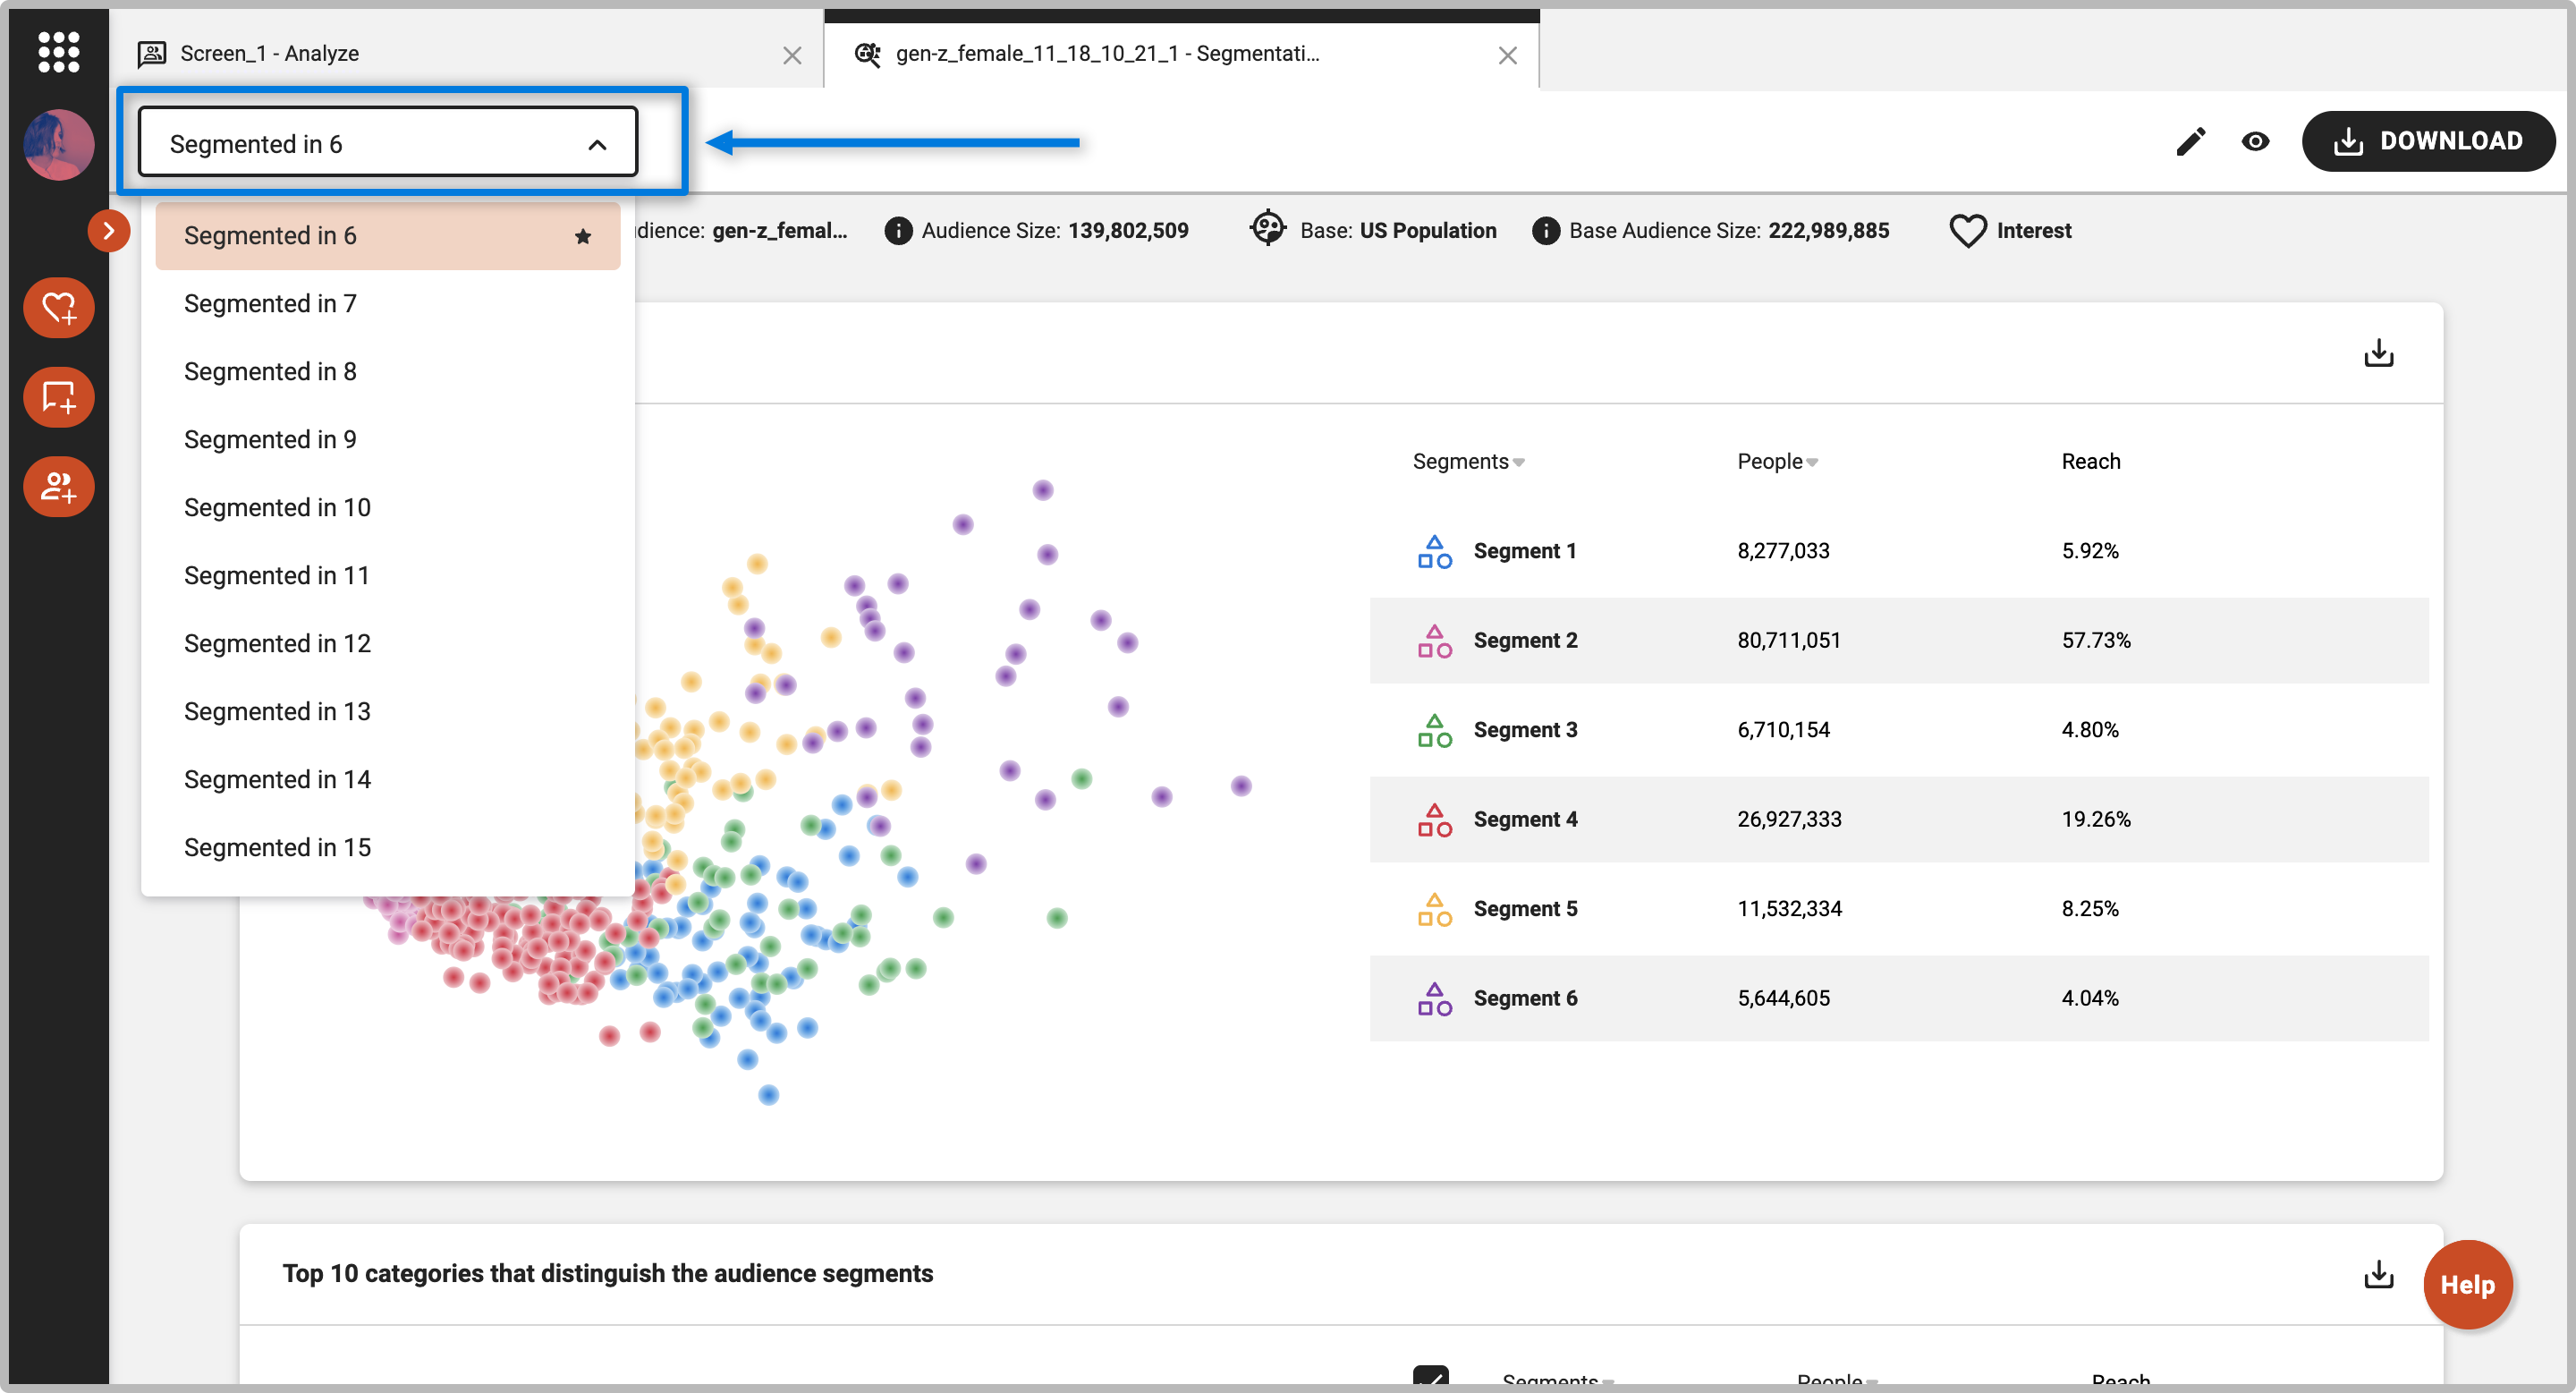
- Once the segmentation is complete, you are able to change the number of segments using the drop-down in the top left corner.
Interpreting Segmentation Results
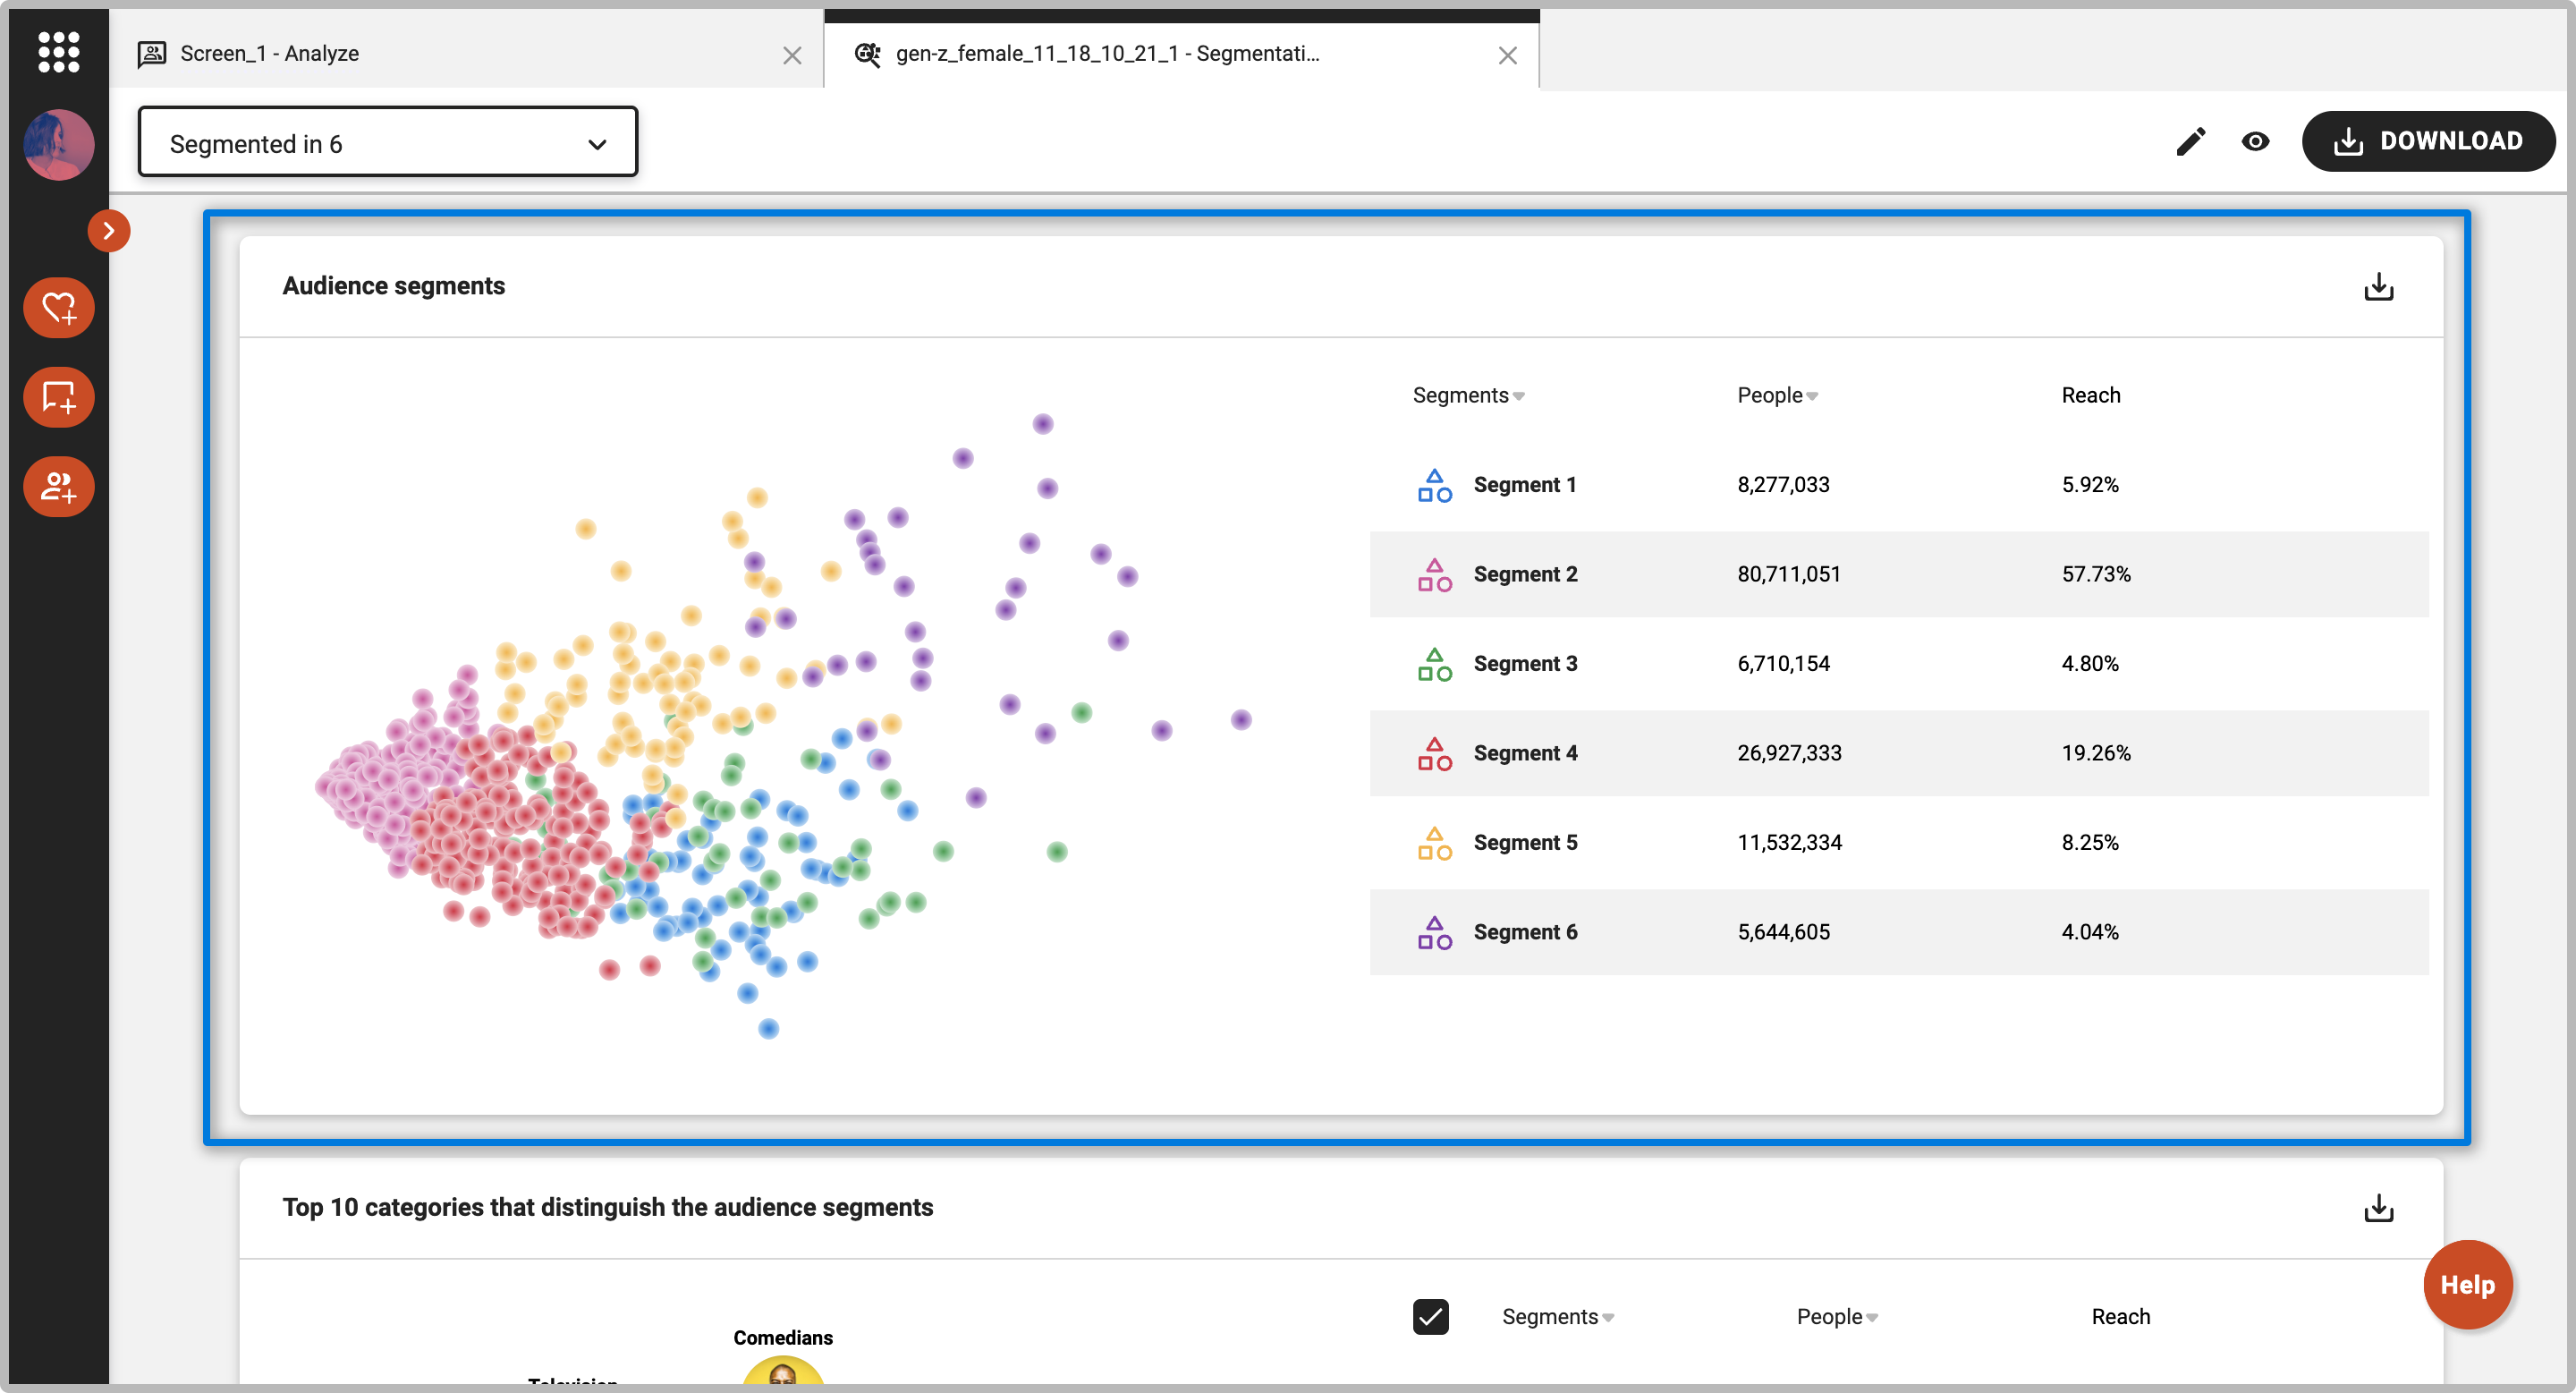
Scatter Plot of Users
- At the top of the segment breakdown, you will see a scatter plot of users showing how similar and different one segment is from another. The scatter plot is color coded where each segment is one color.
- If the dots of the same color are closer together, this means that the users within the segment are very similar, whereas if they are farther apart, the segment is more diverse in terms of interests.
- If the dots for two segments are closer together, those two segments are more similar.
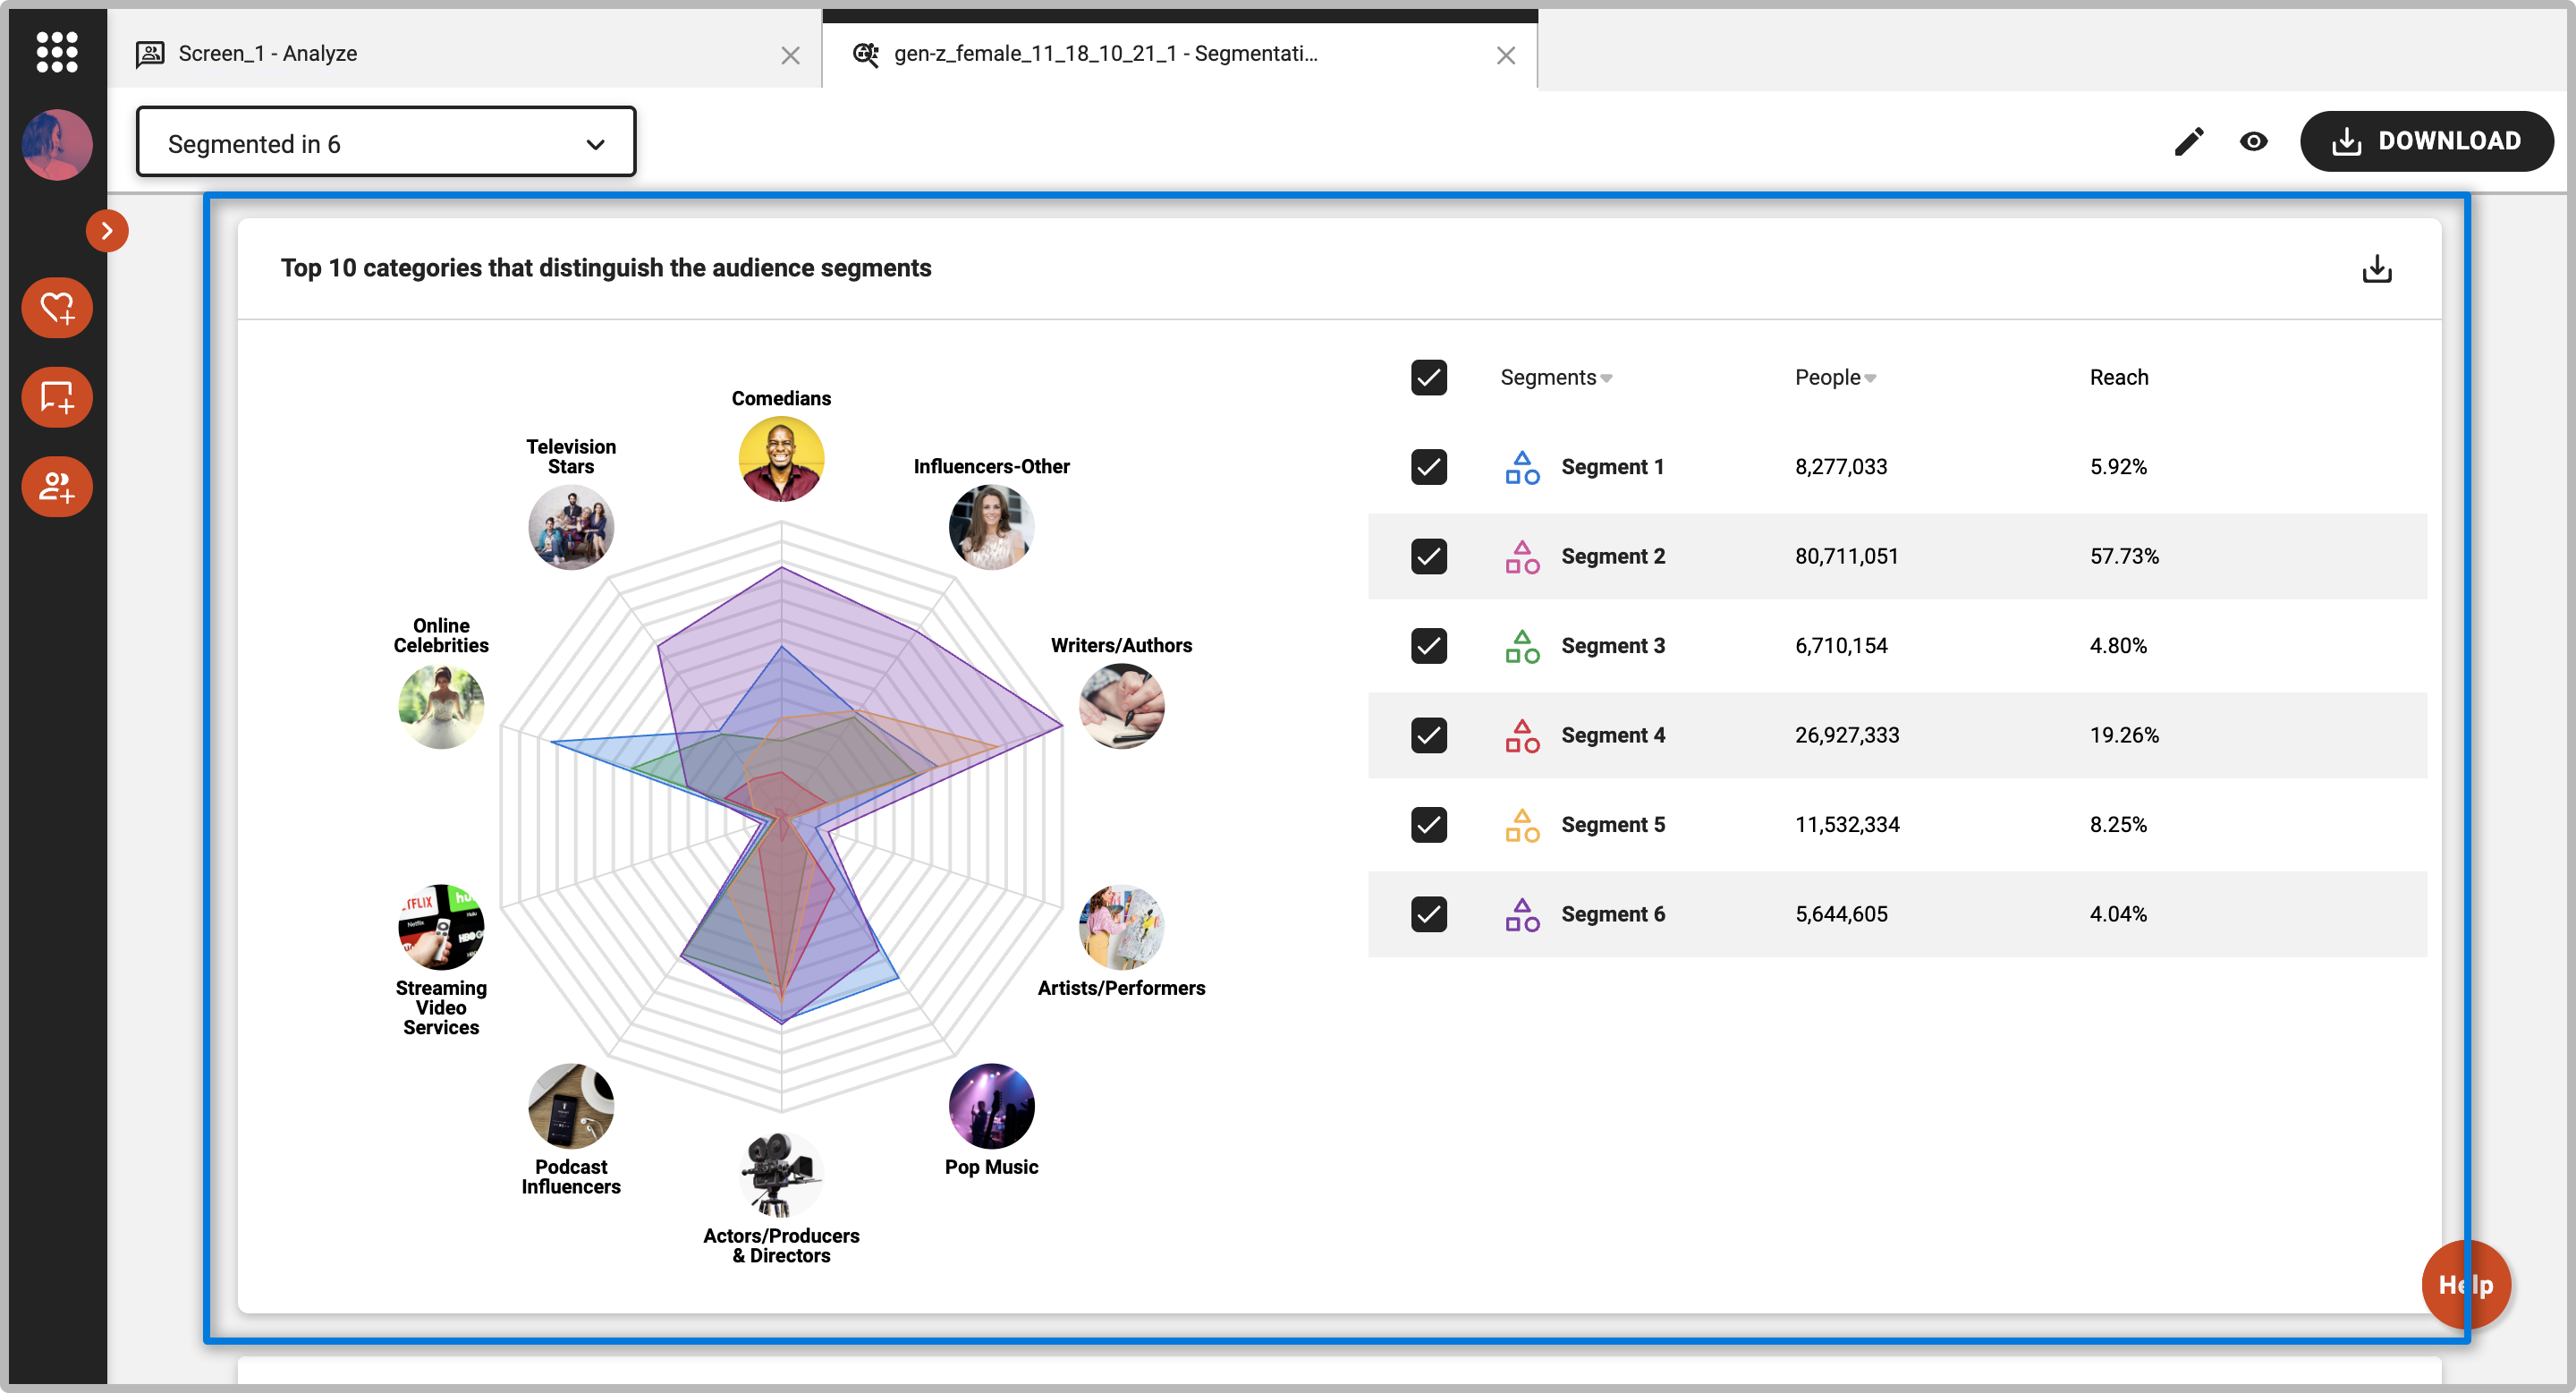
Top 10 Categories to Separate Segments
- The top categories for your audience are shown, along with a radar (also known as web chart) displaying the affinities towards those categories for each of your segments. The further towards the edge of the outside spoke a point for the given segment reaches, the higher the affinity is for that category.
- This allows you to understand interests for each segment at a high level, and what makes them unique.
- You can check or un-check the box next to each segment in order to hide or show it on the chart.
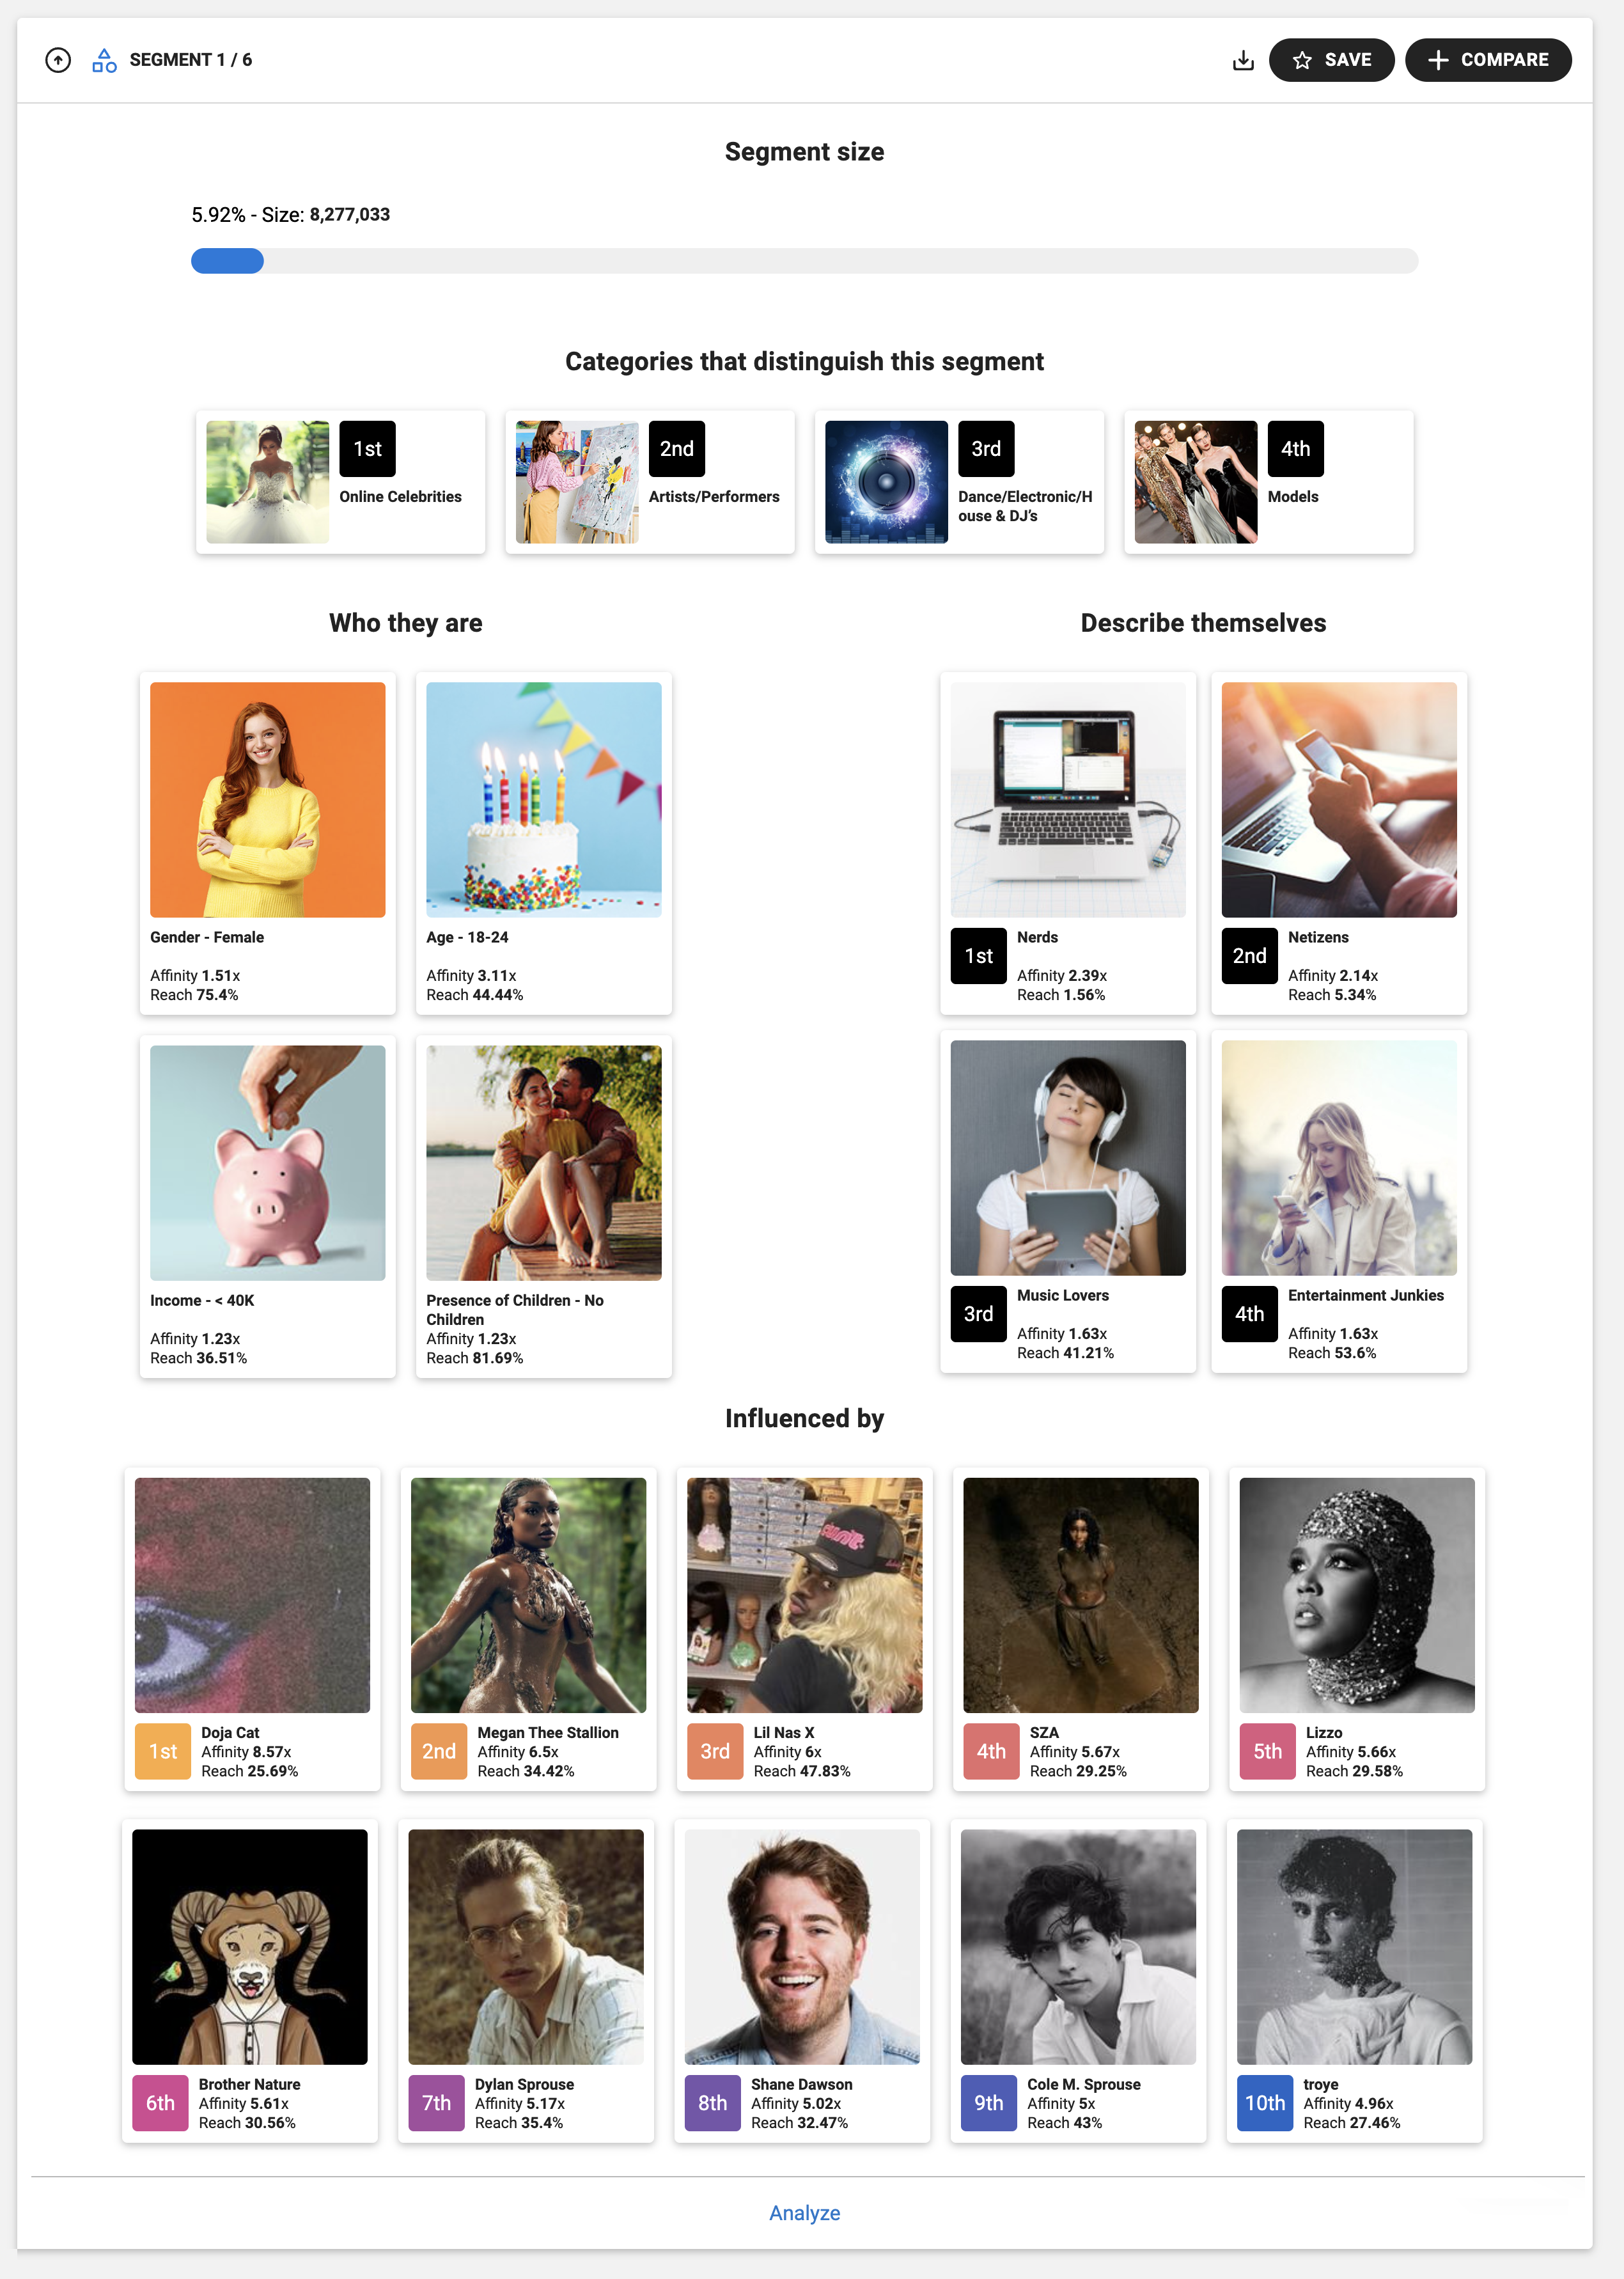
Segment Breakdown
- Below the radar chart you will see a breakdown of each segment, showing the size of the segment relative to the overall audience, the top categories that make that segment unique, and their top demographics, interests, and psychographic lifestyles.
- The size percentage shows you what percentage of the overall audience you segmented is in that specific segment.
- The categories that distinguish this segment show you what distinct interest genres that segment has a high affinity for, compared to the other segments.
- Click “analyze this segment” below the segment breakdown to open up that segment as an individual audience in Discover.
- You can also choose to save an rename any segments to access them later, or add them to a comparison.