2025 Release Notes
November 2025 Release: Version 2.3.0
Workspace
The Explore and Plan dashboards have been replaced with a new and improved Workspace. This update introduces a folder-and-file structure designed to make it faster to organize, find and share projects. Here's what's new:
- Folder & file layout for clear, team-friendly organization
- Enhanced search to quickly find and filter documents or folders
- More control to manage, move, mark as favourite and rename folders and documents
More details here: https://helpdesk.telmarhelixa.com/en/article/understanding-the-workspace-copy
New Features
Q-Text
Q-Text is a feature that allows users to, when hovering over an answer in the codebook, see the full question text used in the survey (provided that the data has that information).
Feature updates
Charting
- Addition of Multi-Series Donut chart type for Combined Charts
- Charts now use the input order as default sorting option
- Global title mode now works when switching to Single Target chart mode
- Charts no longer show NaN when the value is 0
User Preferences
- Gradient Highlights can now be set as a default highlight option
- Highlights can now be set as to be active by default for new reports
Volumetric
- Now supports up to 6 number characters
- The width has been adjusted so the numbers are visible
Bug fixes
- Wildcard warning UI has a typo fixed
- Scroll to top now works properly for combined charts
- Shift-click range selection now works properly in the coding grid
- Undo works properly when seeking to undo a title mode change
- Hovering over chart items in charting now shows all appropriate values
- Fix an issue that errored transferred surveys from SurveyTime
- Tableview in charts no longer exceed the individual chart boundaries
- ALL coding now works as expected
September 2025 Release: Version 2.2.0
New Features
Treeview
Within the coding grid, Treeview is a new way to view the data withing the coding grid by grouping all items with the same Group Name together. It makes it easy to analyze these items together, and perform mass actions on them together. It is accessed from the Coding Grid table view options.
Feature updates
Charting
- Clicking on legends will hide/un-hide that data in the charts
- Chart layouts can be specified as full-width or half-width, allowing for greater flexibility when viewing charts (Combined, Survey group and insight group charts)
- The legend location can be specified for each chart as top, bottom, left or right, also allowing for greater flexibility when working with charts
Trended DataLoader surveys
When trending surveys loaded via DataLoader into Explore, the title of the Survey will now be used to identify each survey instead of the survey code. This will make it easier to identify the surveys within a trended report.
Wildcards in Reports
Reports that have wildcard statements will now show a warning when a half code is added to the column, letting you know how to complete the crosstab, which will need the proper wildcard rows added to the report.
Highlights
- Highlights on a report will no longer be removed when all rows or all columns are removed from the report, allowing for easier analysis as you add and remove different audiences and insights
- It is also possible to preset highlights on an empty report allowing you to setup your highlight conditions prior to adding items into the crosstab
- It is now possible to set highlights as a user preference from an active report Highlight pop-up so that you will not need to always go into the user preferences screen to save a new preferred Highlight rule

Title Mode
Title mode changes now apply globally in all modules
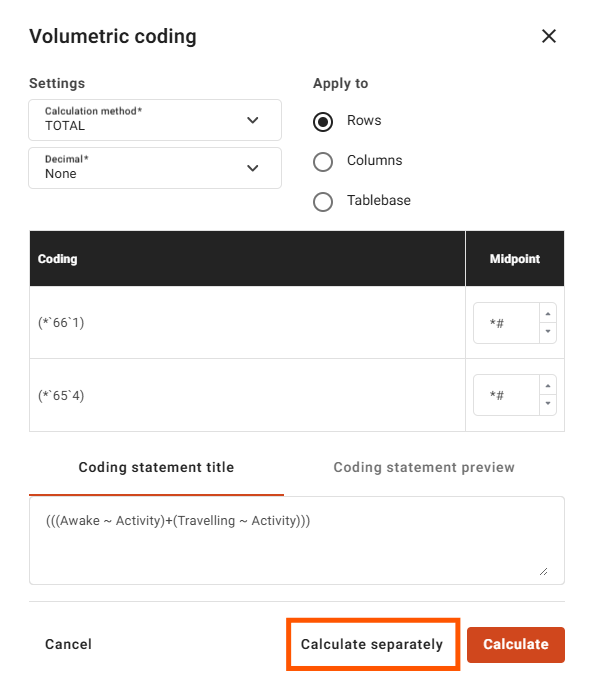
Volumetrics
A new add separately option is now available, and this will allow you to easily apply volumetric calculations like Means, Medians and Totals to bulk items individually.
Exports
- New ASCII export option added when exporting from the Reports module
- Export workflow has been simplified into a dropdown list when exporting from all modules except Reports
User Preferences
Now accessed only via the Dashboard to reduce cases of mistakenly opening the user preferences page from an active report
Bug fixes
- Explore no longer freezes when an export has an error
- Sorting no longer causes collapsed rows to expand in Separated rank view
- When opening a report containing a survey not available for the active account, an error message is shown that explains this
July 2025 Release: Version 2.1.0
Feature updates
Drag and drop
- Drag and drop on add to buttons now defaults to a separate add
- Drag and drop glitches have been resolved when combining and adding items to report
Heatmaps and Highlights
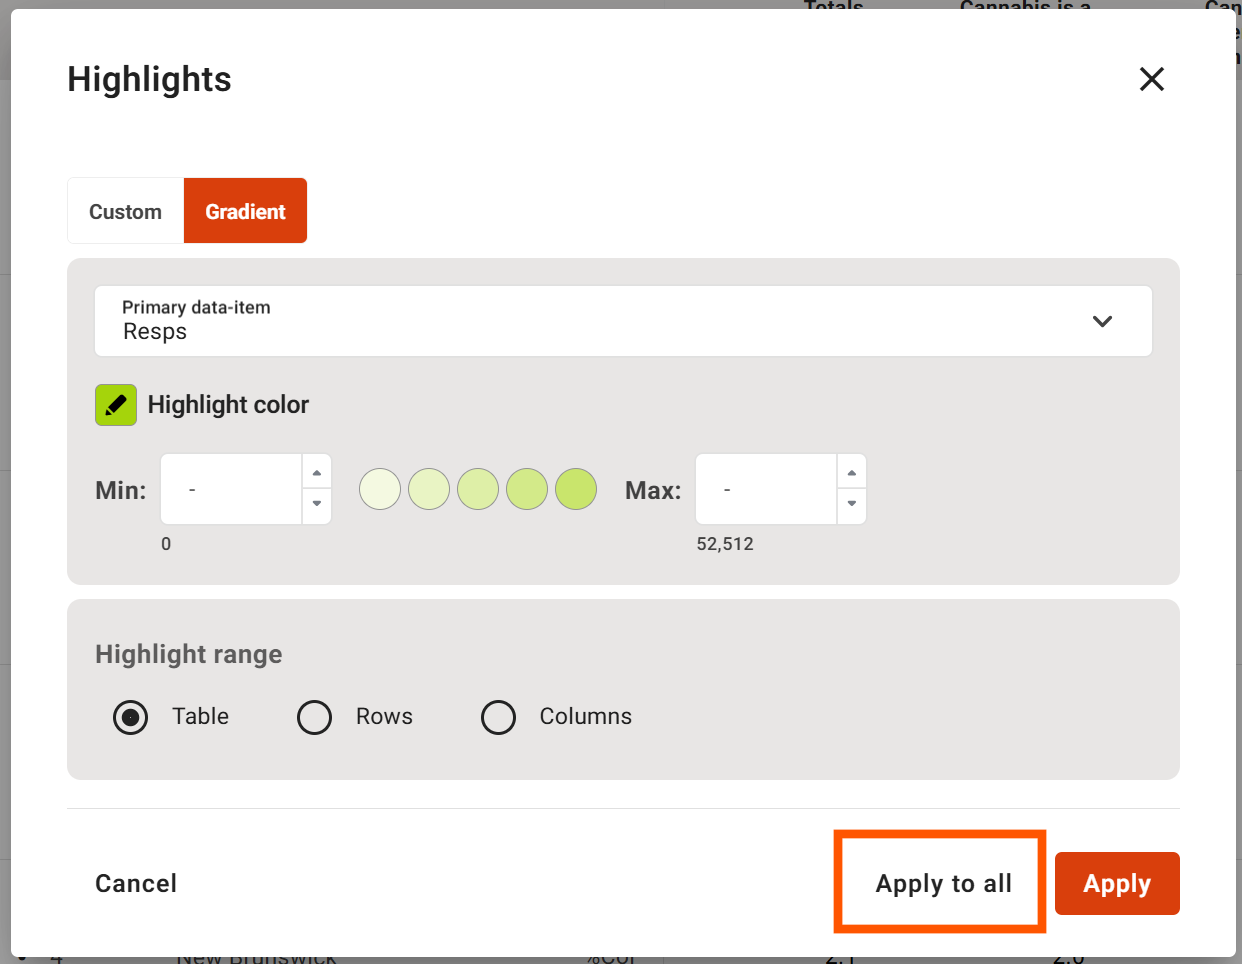
- The ability to Apply heatmaps or highlights to all report views is now possible by using the Apply to all button on the pop-ups.
Sorting
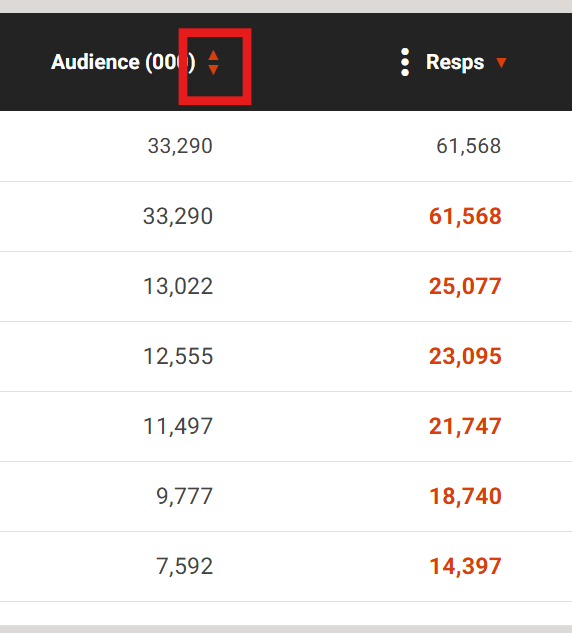
- Sort order for all tables now cycles through a predictable descending, ascending and default options, in that order
- All sortable tables/columns will now show a sort icon to indicate that
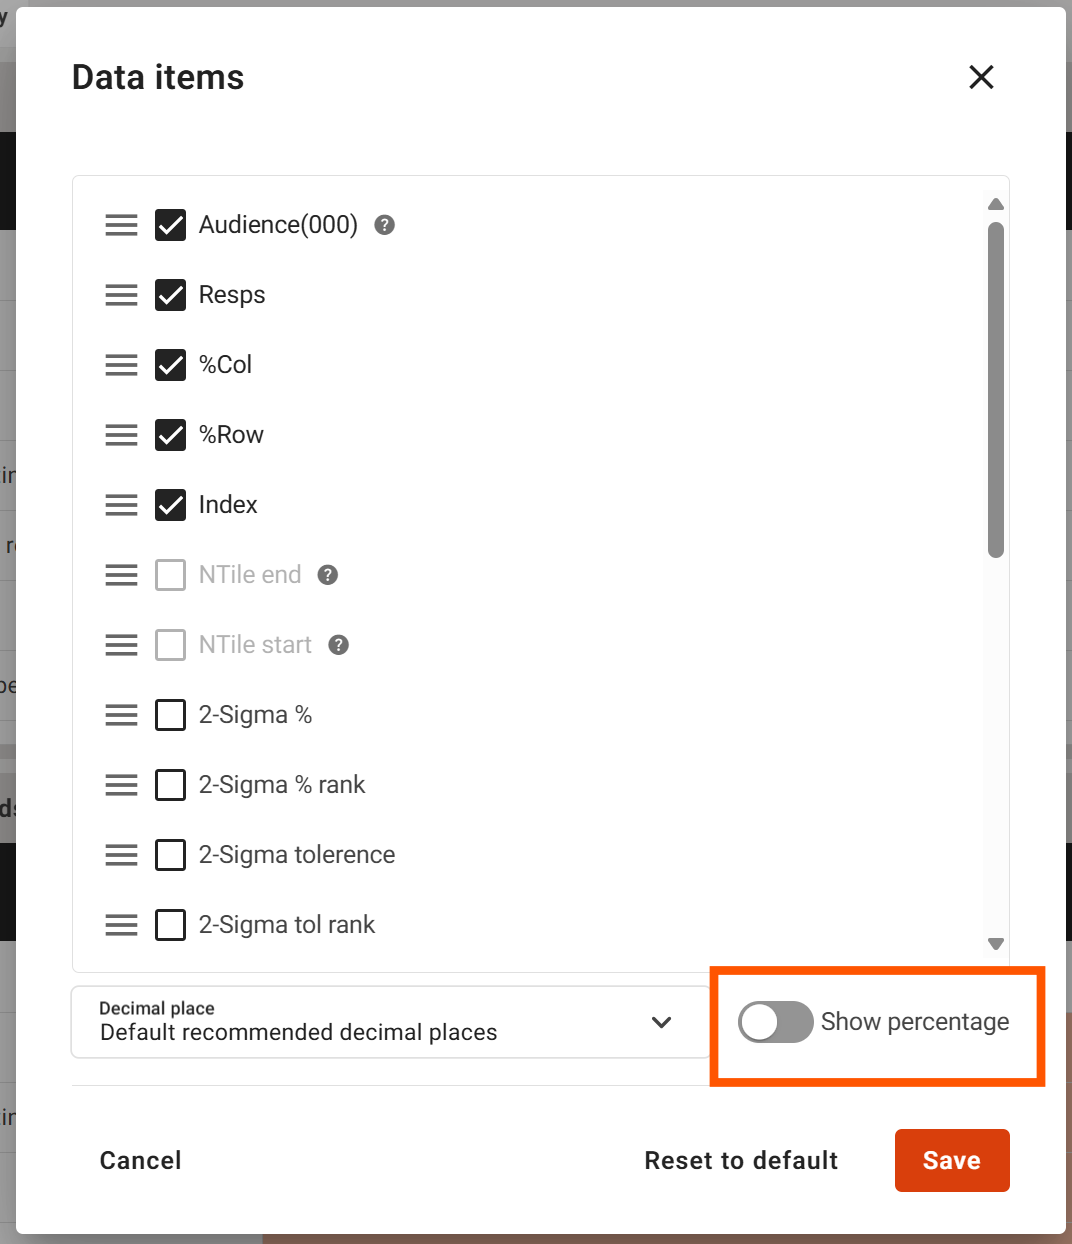
Date items
- It is now possible to specify if the % symbol will be shown in the crosstab where applicable via the Data items modal