
2026 Release Notes
Version 3.4.0: May 12th
Summary
This release includes Cell Menu, a new feature that allows actions like highlights, to be done from a specific cell. Data items modal was updated to support individual decimal places for each data item, and some bugs were fixed.
New Features
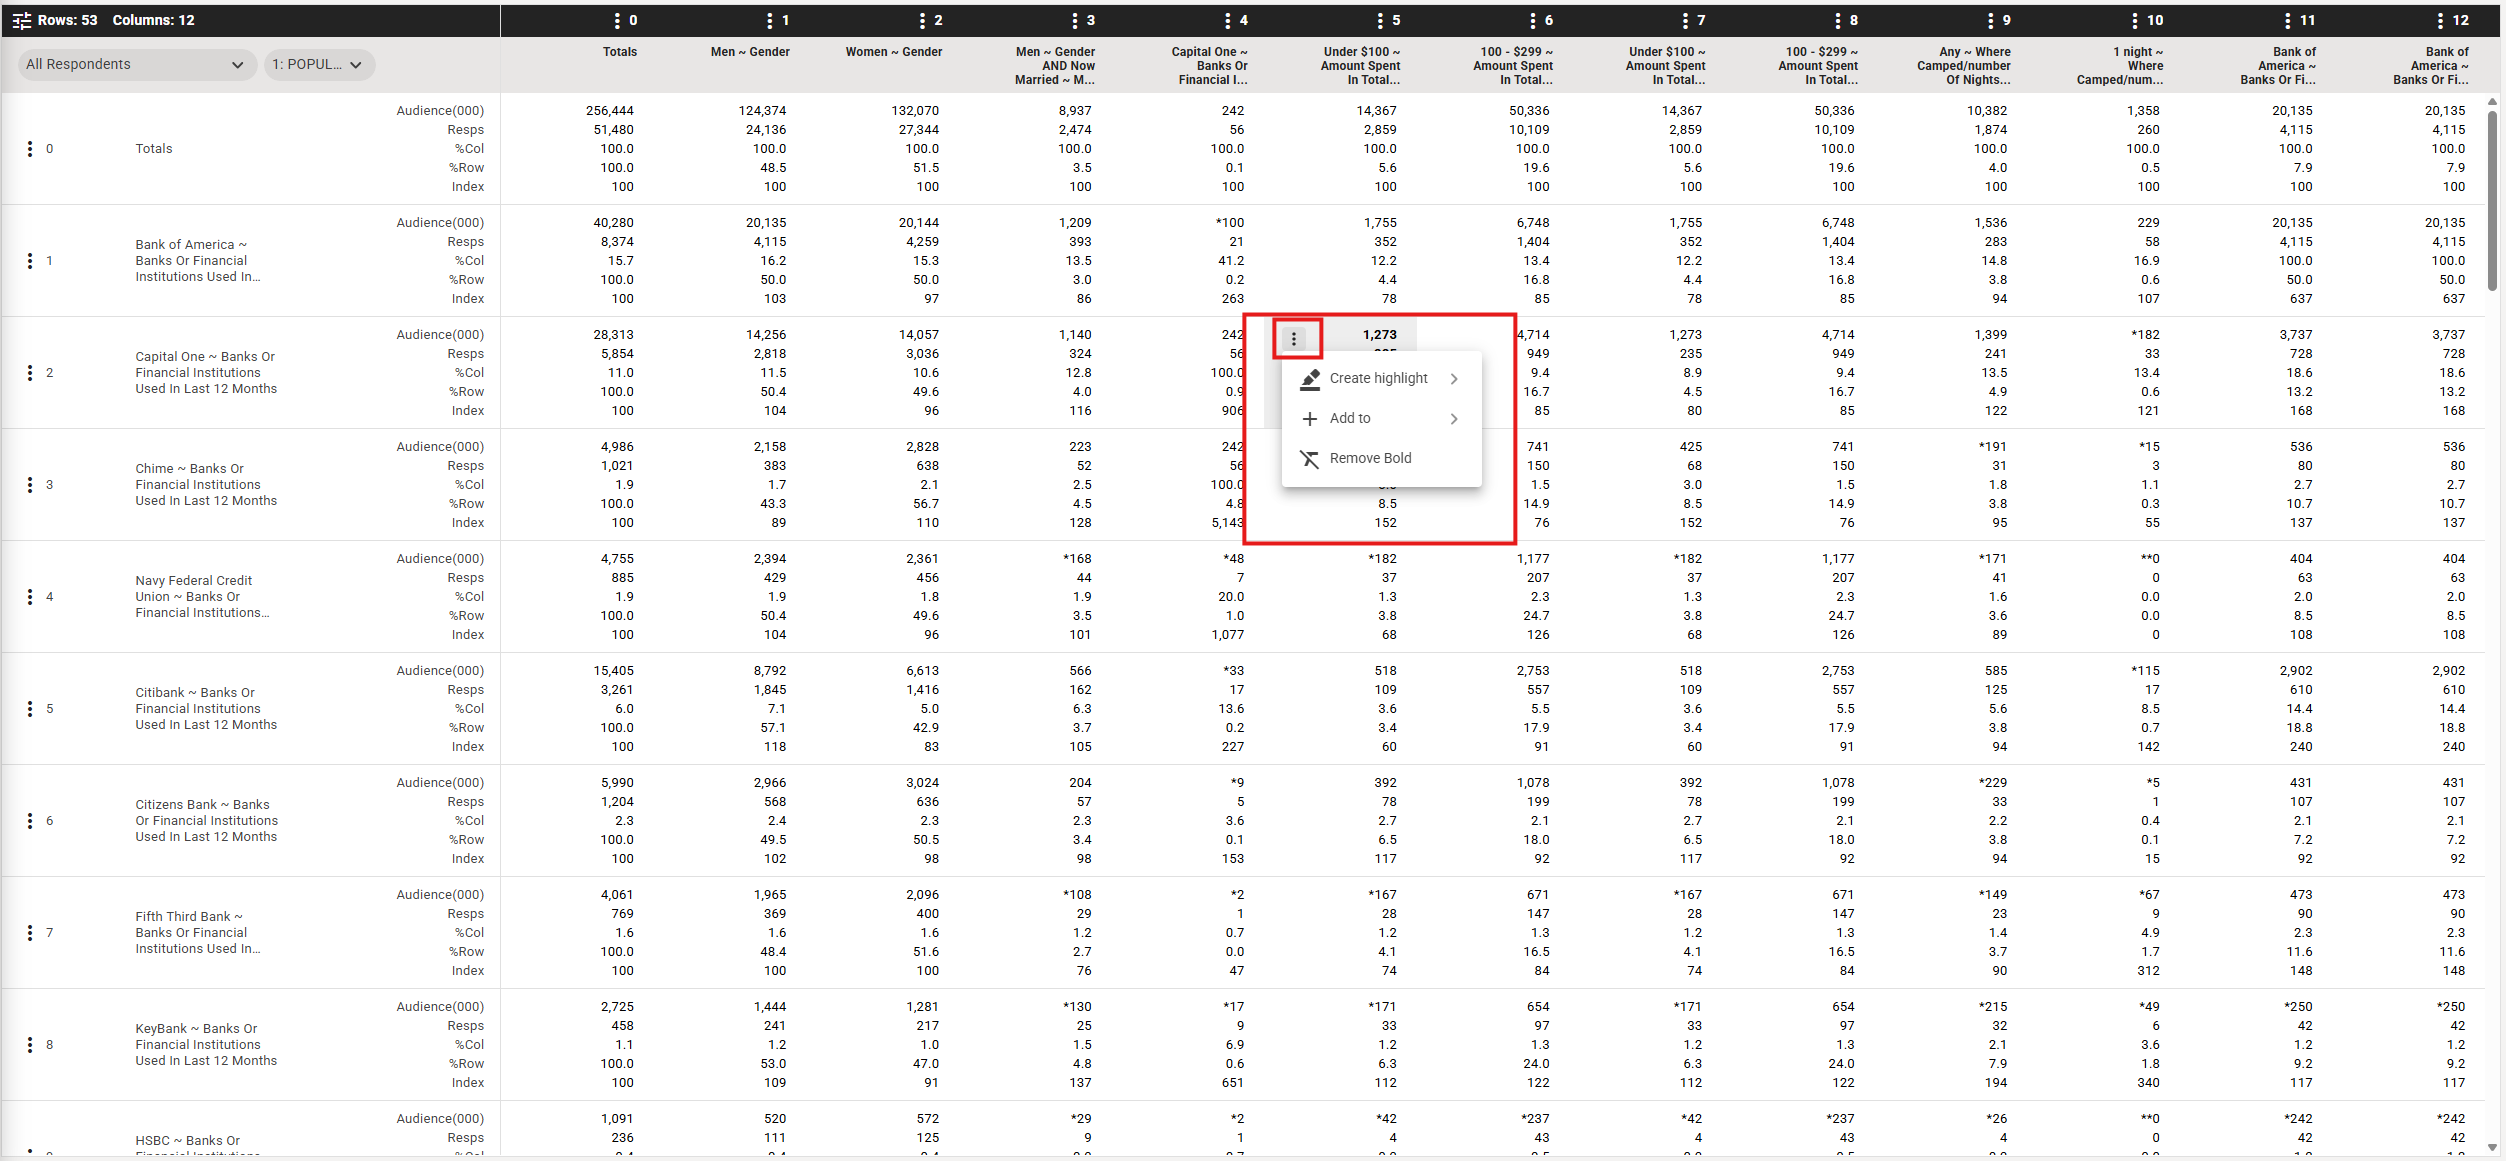
Cell Menu
Cell Menu is a new feature in the Crosstab that allows you to choose a cell and quickly apply highlights on cells that over index or under index when compared to your target cell.
You can also add that call as a tablebase, column or row, and apply a Bold format as another way to make that cell stand out in your crosstab
Improvements to existing features
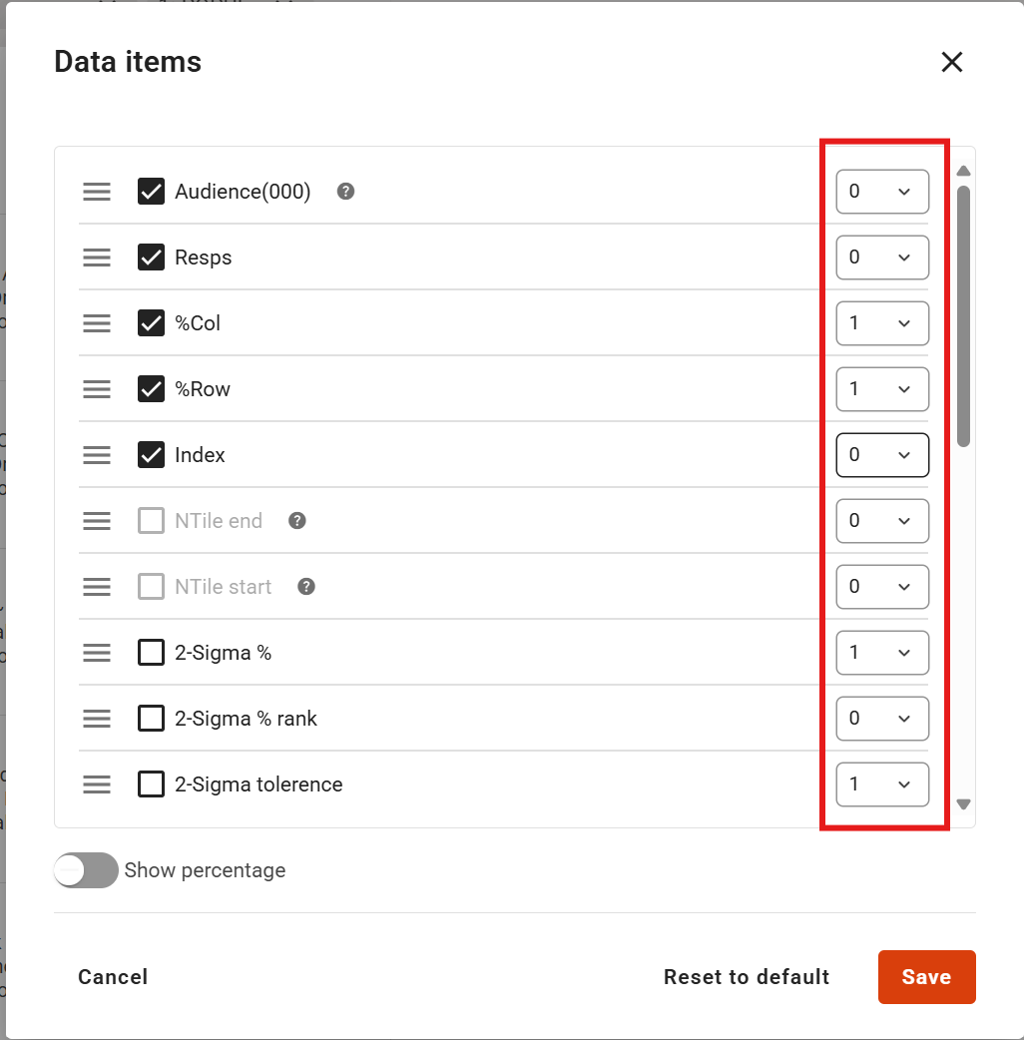
Data items formatting
You can now apply specific decimal places to data items from the Data Items modal
Bug fixes
- Users will no longer be able to select non-trendable surveys when setting up a trended report
- CHAID analysis tooltip no longer overlaps data in Audience Effects
Version 3.3.0: April 28th
Summary
This release introduces a range of enhancements to coding workflows, quick reports, snapshots, Discover, and audience management, along with multiple usability improvements and critical bug fixes to make using Explore smoother.
New Features
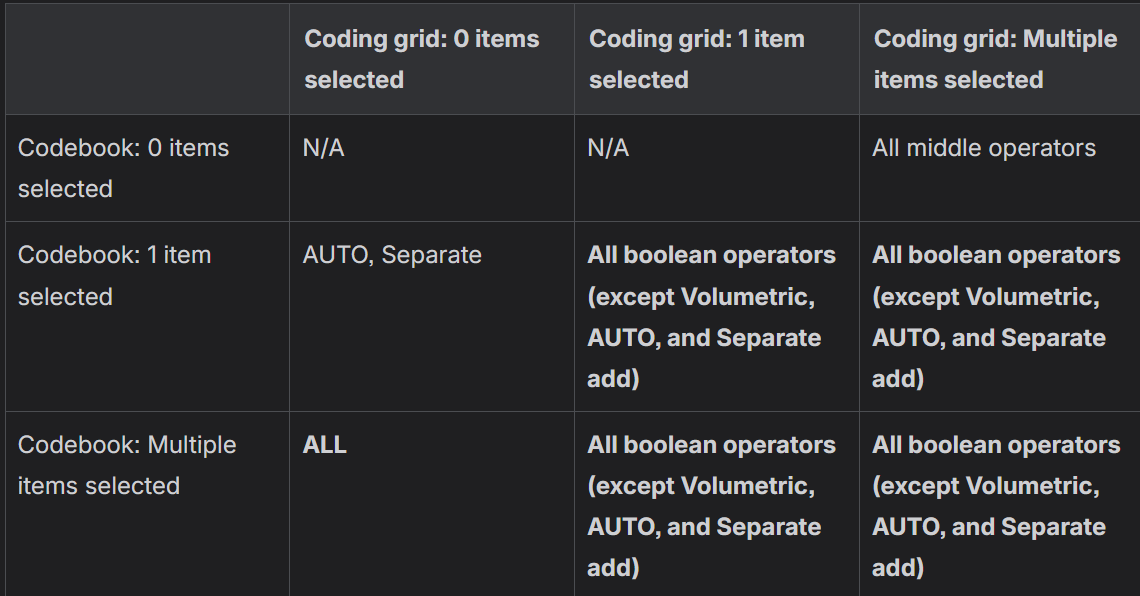
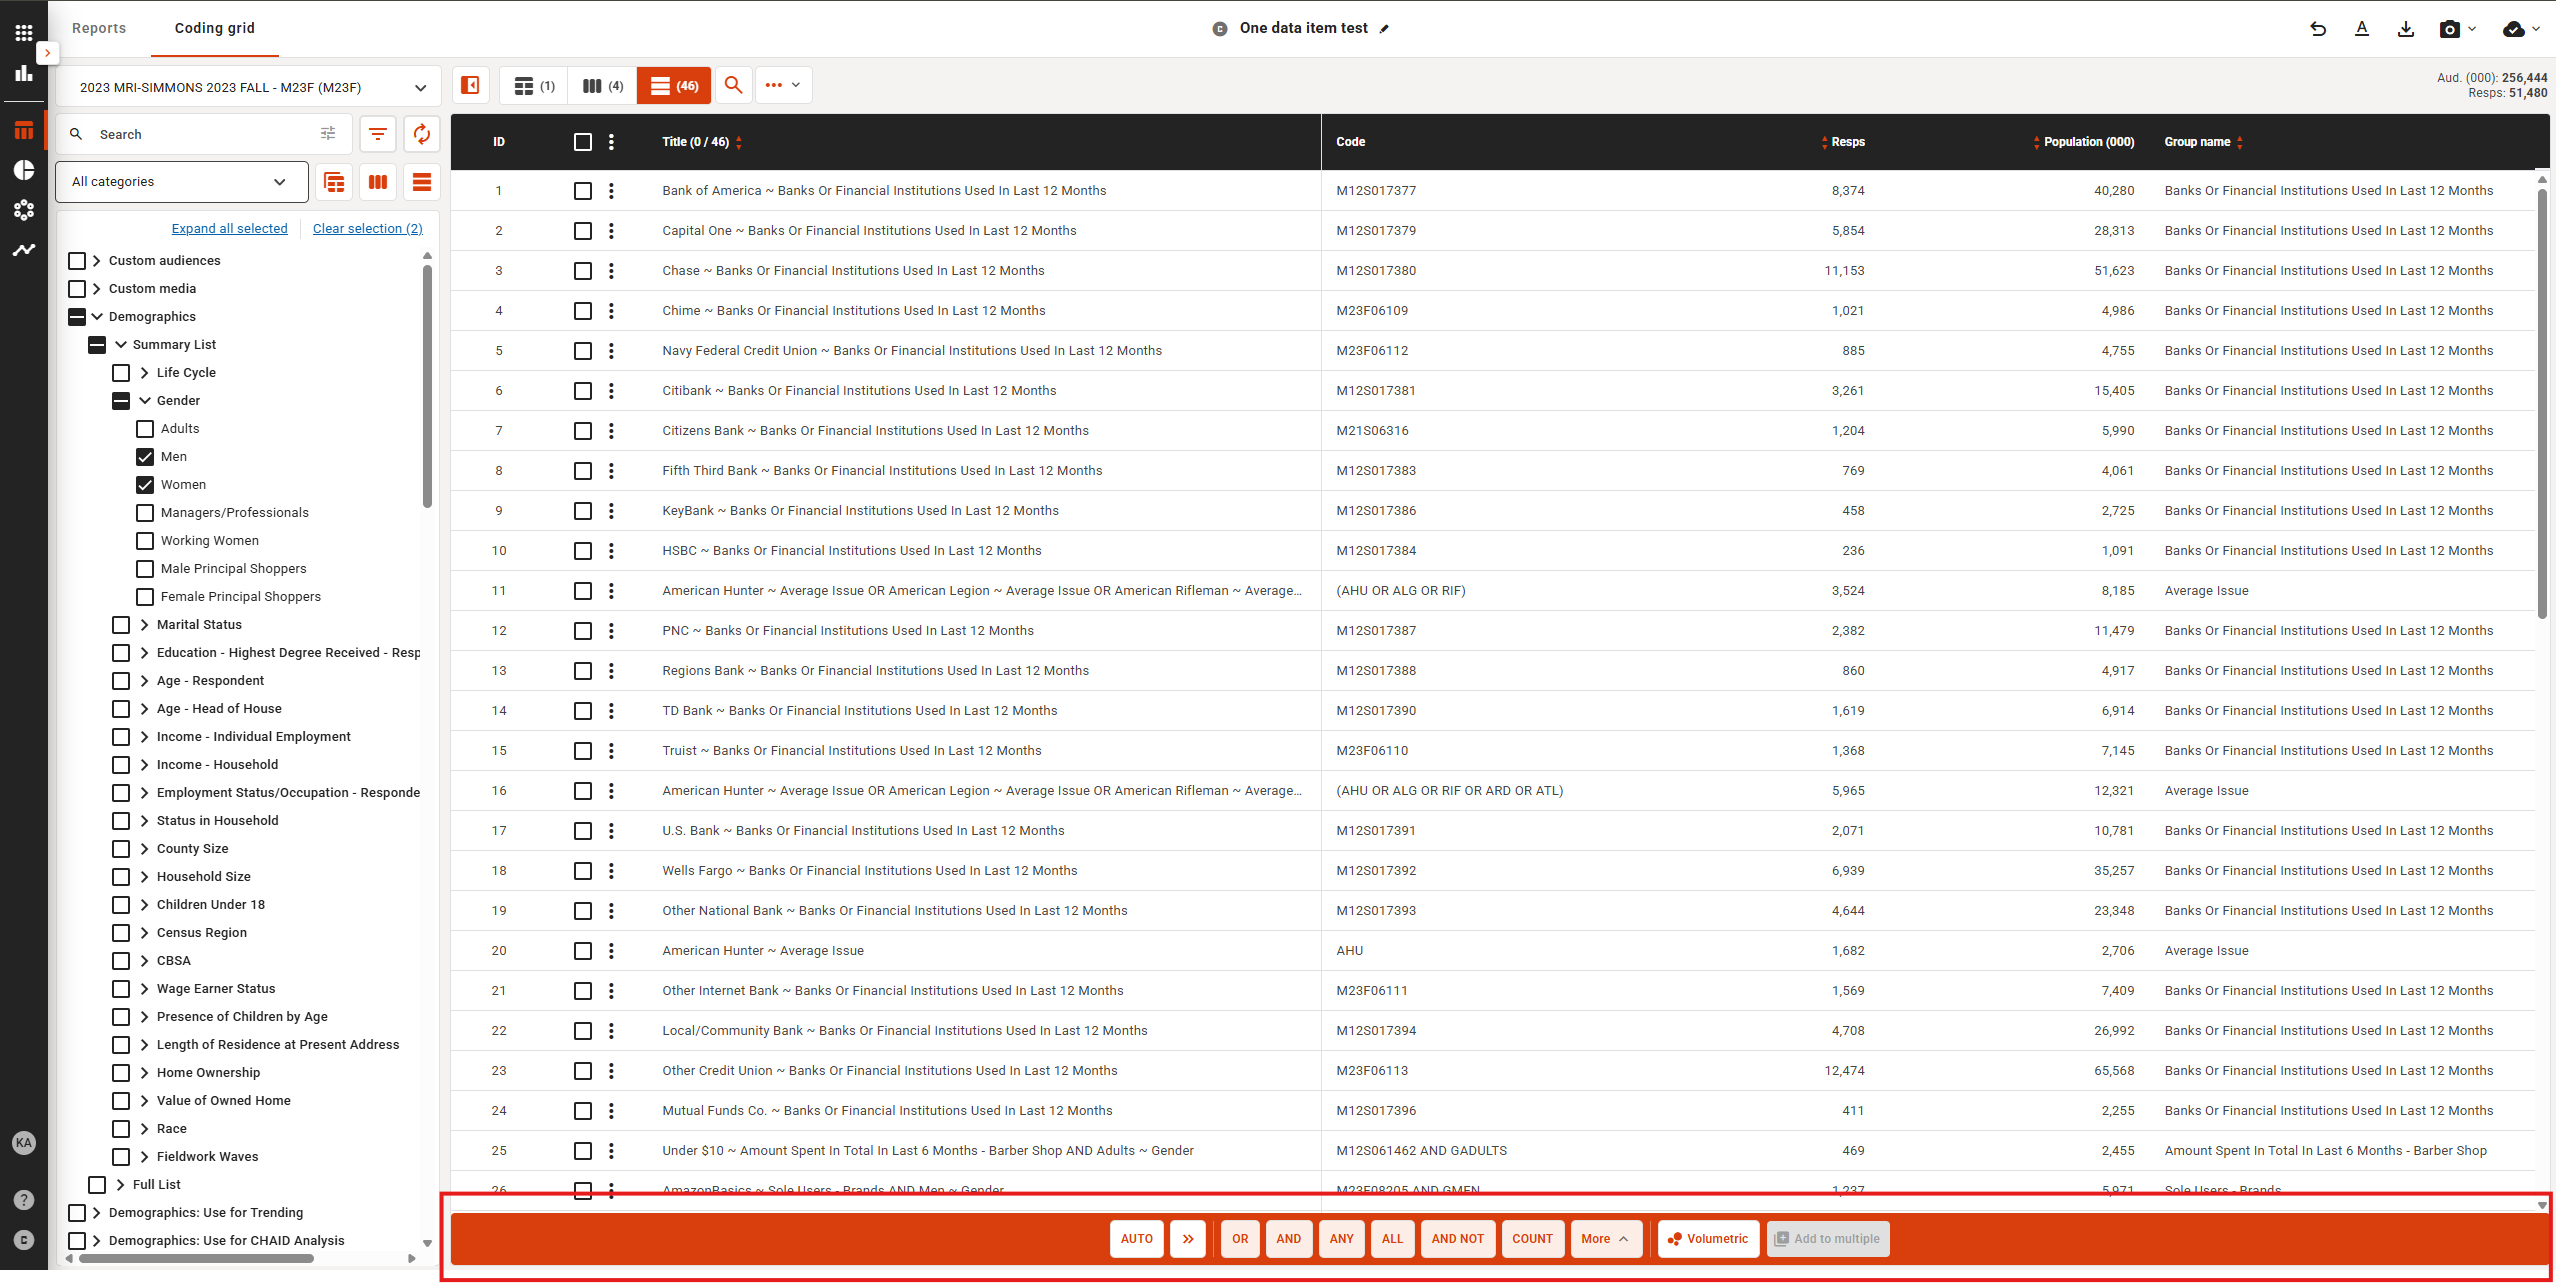
Coding bar
- New combination UX for the coding grid to streamline building and managing combinations.
- Coding grid “Add to multiple” workflow updated to simplify applying changes across multiple items.
- Matrix for how this works is outlined in this table:
Import Custom Audiences
- Ability to use a custom audience created for another survey (i.e. Importing custom audiences), enabling reuse of audience definitions across reports. To Import a custom audience:
- Create a report
- Open the report settings dropdown and choose “Manage custom audiences”
- From the list, make sure the filter is on ”Show all”, and choose the custom audience to import
- Click on the audience, or click on the kebab menu for that audience and choose “Import custom audience”
- You will see the list of codes in the Existing columns, and if the codes are incompatible with the report, the aud (000) and resps values will not be shown
- Click on Save and the custom audience will be imported into your codebook, and will be shown in your Custom Audience codebook category
Data items
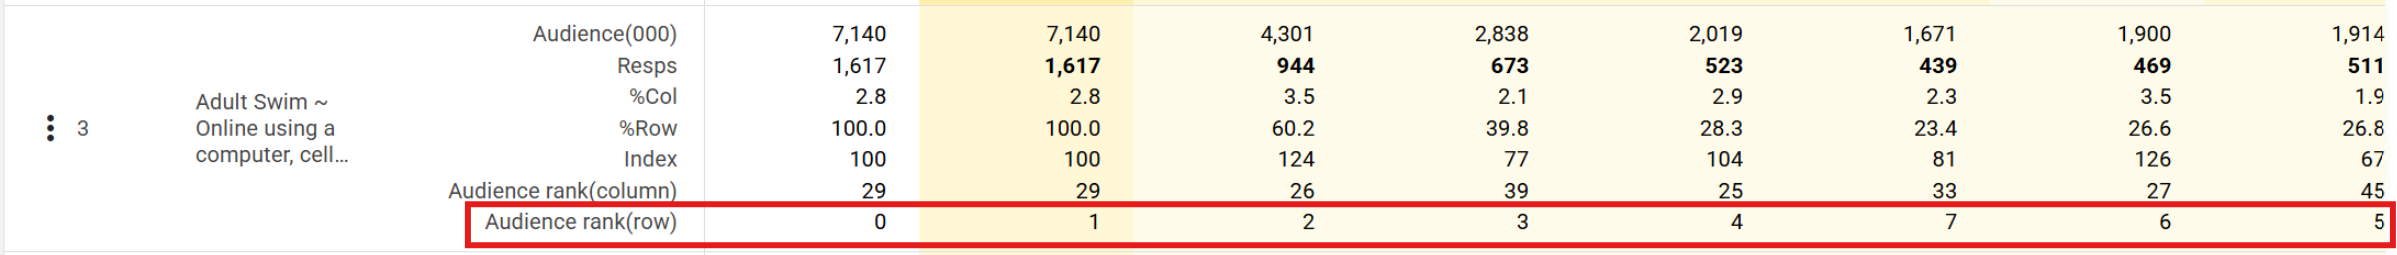
- A new Audience rank (row) data item has been added as part of the data item options. Audience rank sorts the Audience value for each row and ranks it from the highest to lowest.
Report analysis updates
- Quick reports now include a search button in the edit data modal for faster item look-up and the ability to swap rows and columns in Quick Reports to customize how results are viewed.
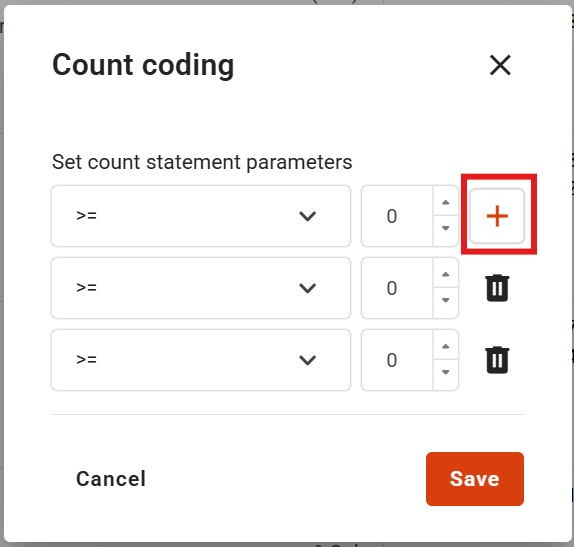
- Ability to set multiple counts in a single action, which will make comparing count codings more efficient
Codebook Show Resps
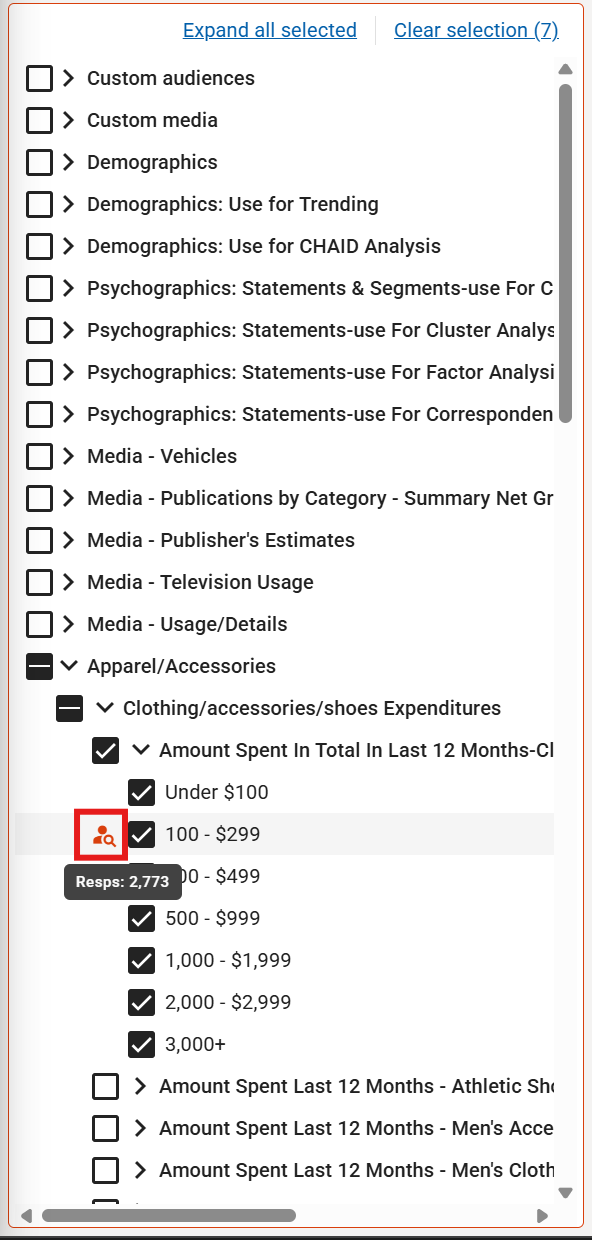
- Show respondent counts next to codebook answers to provide immediate context on resps size. Hover of the new Show resps button next to the codebook answers and the respondents size for that item will be shown.
- If the tablebase changes, click on the Show resps button to get an updated resps number for that item.
Improvements to existing features
Snapshots improvements
- Snapshots now duplicate document snapshots when a doc is duplicated, preserving historical context.
- Snapshots crosstab export access enabled for all users, broadening access to exported views.
Codebook and coding usability
- Coding grid maintains item selection after drag-and-drop actions complete.
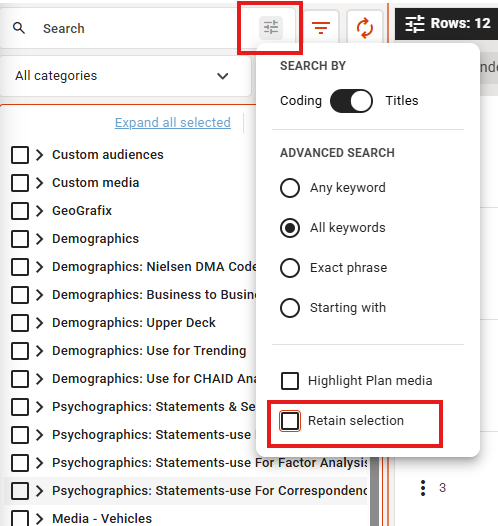
- Codebook filter field now shows a history of filter terms per session, making it easier to reuse recent filters.
- After a filter is done, search on the codebook screen now only searches the filtered items, making results more relevant.
Segmentation Apps
- Audience Effects now filters out incompatible volumetric items for CHAID analysis, ensuring cleaner and more reliable results.
- Correspondence Analysis updated so axis placeholder text also includes the data mapped.
UX refinements
- Survey select modal width has been increased for better readability and selection.
- PMaps labeling improved for clearer maps and insights.
- Crosstab scroll-to-top button is now visible only on hover, reducing visual clutter.
Version 3.2.0: March 19th
Summary
This release adds the ability to insert codes from the codebook into the coding grid, in between existing items. Up to 10 surveys can now be trended together, Stability flag exports show the definitions of the flags, and the X and Y axis of Correspondence Analysis can now be named.
Improvements to existing features
Coding grid
Our previous update (3.1.0) allowed for custom codes to the added to the coding grid. Now, we’ve improved that feature with:
- Codes from the codebook can be inserted into the coding grid by dragging the item(s) to the desired row, and choosing to insert it above or below that row item
- A new “Add code” text is now present when hovering over the last row of the coding grid
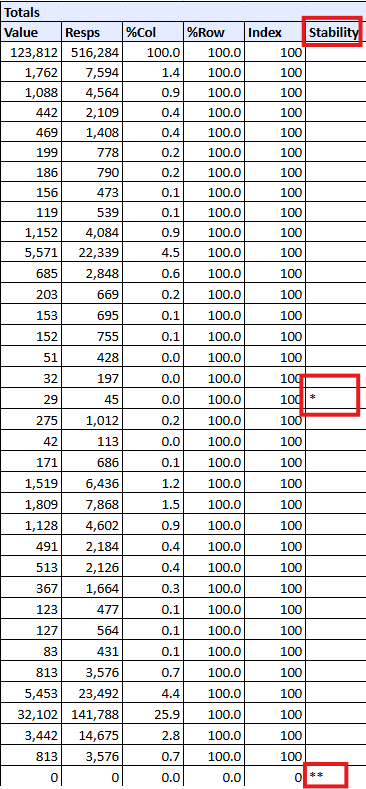
Stability flag exports, Trending surveys
- When stability flags are exported, the Excel or Google Sheets file will now show the flag definitions for clarity
- Up to 10 surveys can now be trended together
Codebook
- You can now choose between having the codebook items remain selected after adding items to the report, or having the codebook items deselected (which is the default)
- The filter button UI shows a shade when you have an active filter in the filter box
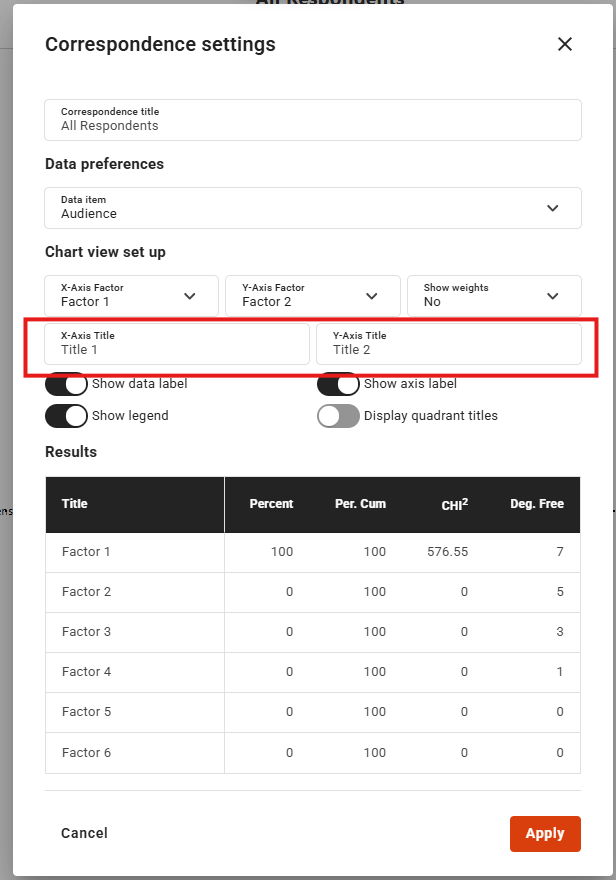
Correspondence Analysis
A custom name can now be set for the X and Y axis of the Correspondence graph
Version 3.1.0: March 3rd
Summary
This release contains new ways to customize annotations on PMaps and Correspondence Analysis, ability to export stability flags and a quick way to set a custom title in the crosstab. Some bugs were also fixed in this release.
New Features
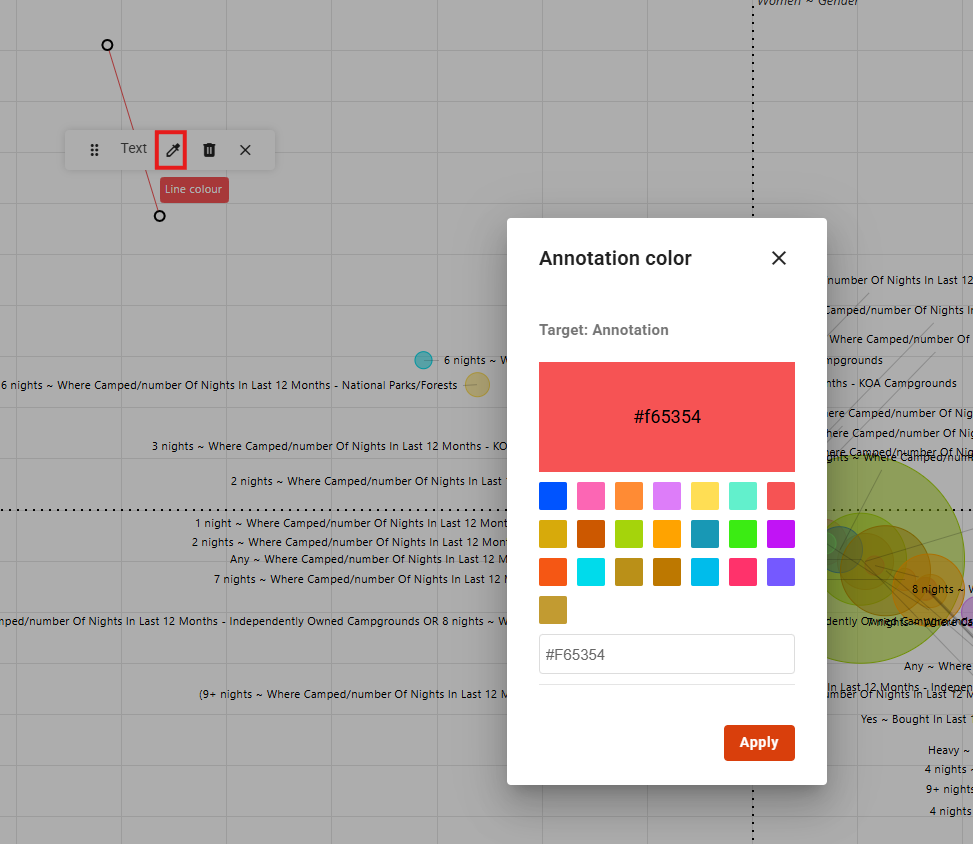
Customize annotation colours
For Pmaps and Correspondence Analysis, annotation mode now gives you the ability to customize the colour of your lines or text so that you can make these stand out in presentations and exports.
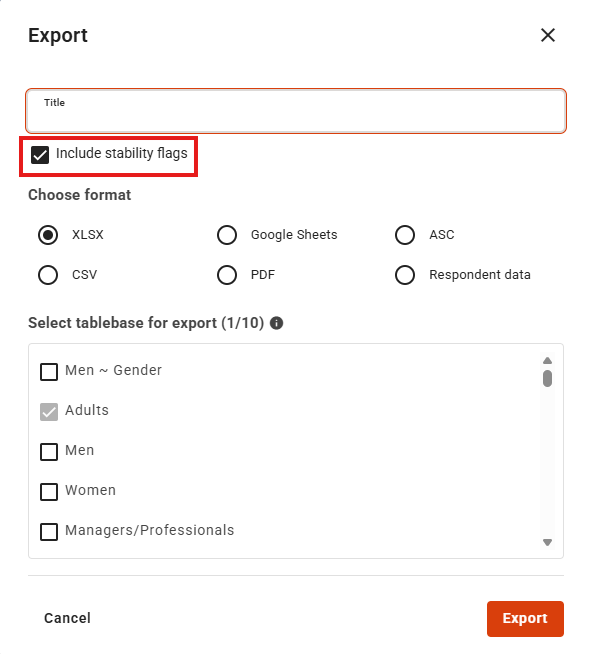
Ability to export stability flags
When exporting to Excel or Google Sheets, you can now specify if stability flags will be exported as well. If exported, the stability flags will be in a column called Stability, or as a data item called Stability, and if a row has unstable data, the appropriate flag will be shown in that cell. If the row has stable data, the cell will be blank.
Improvements to existing features
Titles
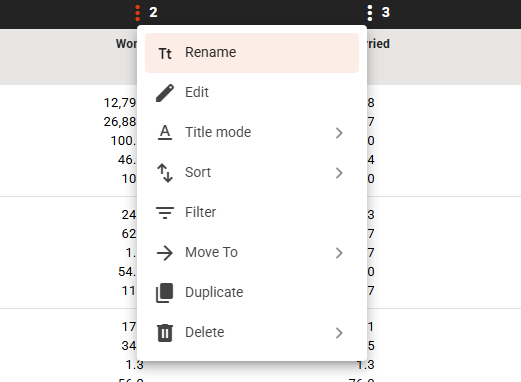
Clicking on the kebab menu for a row or column in the crosstab allows for you to quickly rename an item without the need to open the Visual Code Builder.
Codebook
- Codebook state will persists when changing between different modules. This means there's no need to always re-open to the last category or sub-category that was being used when switching between Data and Charts modules, PMaps, Geografix and Segmentation Apps
Demo video: https://drive.google.com/file/d/1fjwd3TU7nxZKyWcEn8VdxwMPSwhrBbCN/view?usp=sharing
- Shift select now possible to easily choose range of items in the category filter dropdown
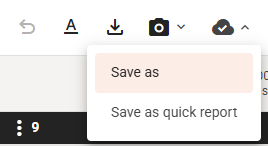
Save as
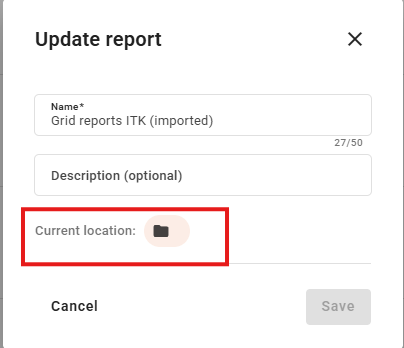
The workflow of saving a report has been improved to make it easier to save as a report or quick report, and to allow for choosing the location of the new file. Additionally, accessing the Update report pop up now allows for the drive and folder location to be updated
Demo video: https://drive.google.com/file/d/1STmacOB-GZZEjXkt30hXMaCzHPhH6gOm/view?usp=sharing
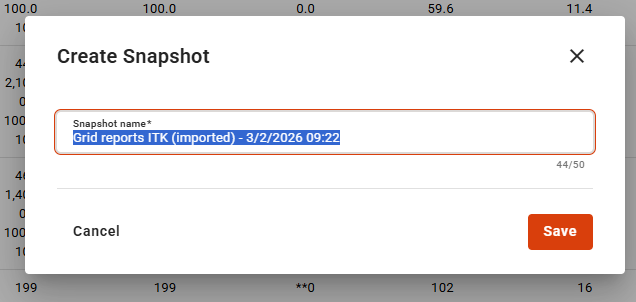
Snapshots
When creating a snapshots, the name can now be set, making it easier to manage snapshots
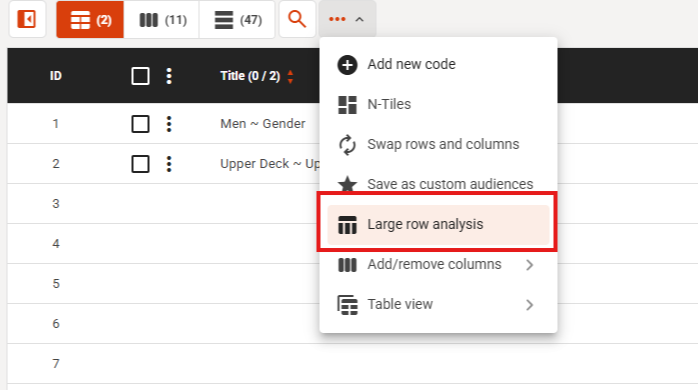
Coding Grid
- Ability to insert a custom code, or item from the codebook, between rows in the Coding Grid
- Large Row Analysis can now be accessed from the coding grid
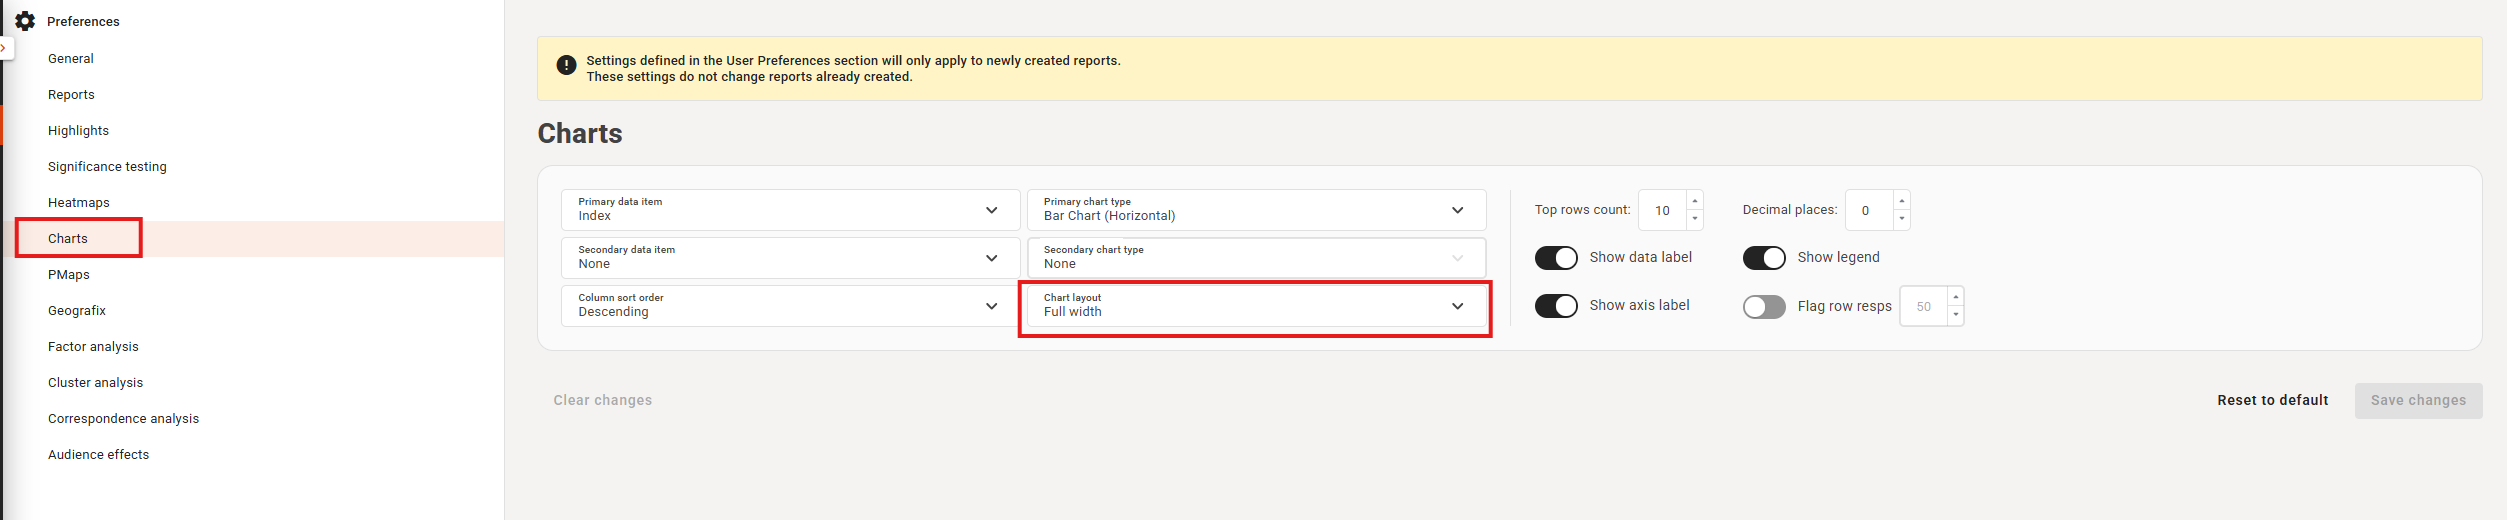
User Preferences
Chart width can now be saved as a user preference
Bug fixes
- Data item decimals now properly apply to Value data items (e.g. means)
- Changing the global title mode when in grid reports no longer switches users to the crosstab
- Annotation mode now works correctly in PMaps and Correspondence analysis
- Chart no longer resets after changing title mode in half-width layout
- Multi series donut charts now shows the proper colours
- Decimal places now applied to Value data items
- Radar charts highlight colour now works as expected
- Improved the drag and drop into the coding grid to be less jittery
- Cases of the tooltip of the operator remaining visible should no longer occur
Version 3.0.0: January 27th
Summary
This release focuses on improving analysis workflows with flexible tablebase creation, sortable grid reports, global Top N function for Separated rank and Q-Text and A-Text improvements. A broad set of bugs have been fixed including: codebook selection stability, Quick Reports bug fixes and UI cleanups.
Improvements to existing features
Q-Text & A-Text
- Q-Text and A-Text now properly show when hovering over the question or the answer in compatible surveys

Tablebases
- Drag and drop to create a new tablebase is now possible
- In View-only quick reports, users can now add or create a custom tablebase
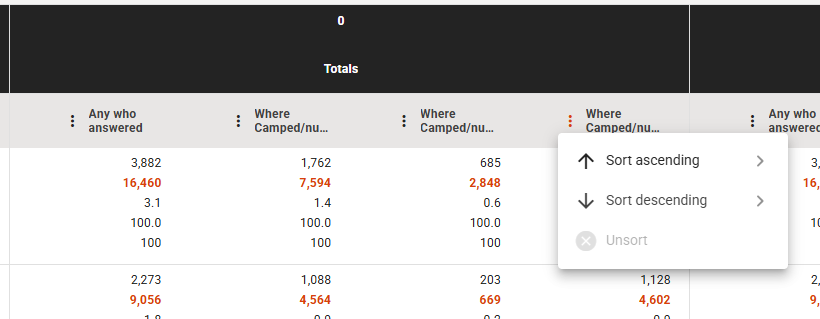
Grid Reports
- Sub-columns can now be sorted when in Grid reports
Large Row Analysis
- Settings used for previous LRA are passively saved
Separated Rank
- Show top N now applies globally to all Separated rank tables
Segmentation Apps
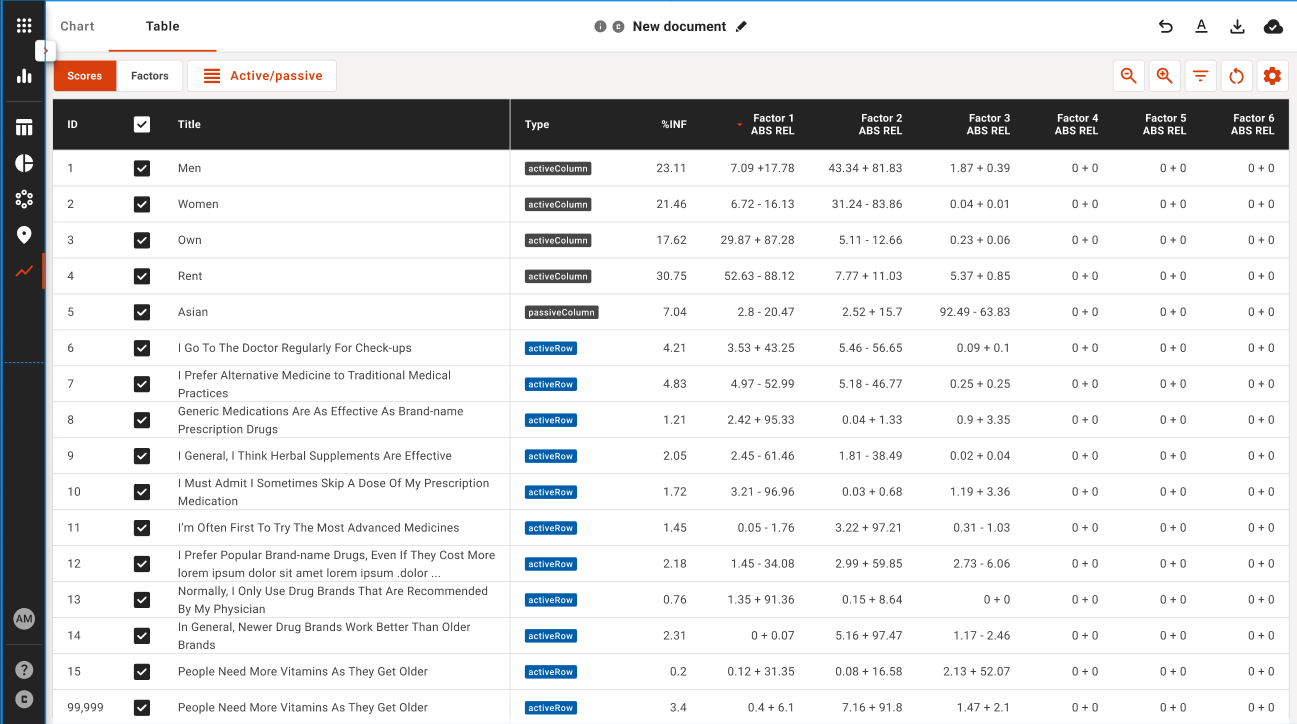
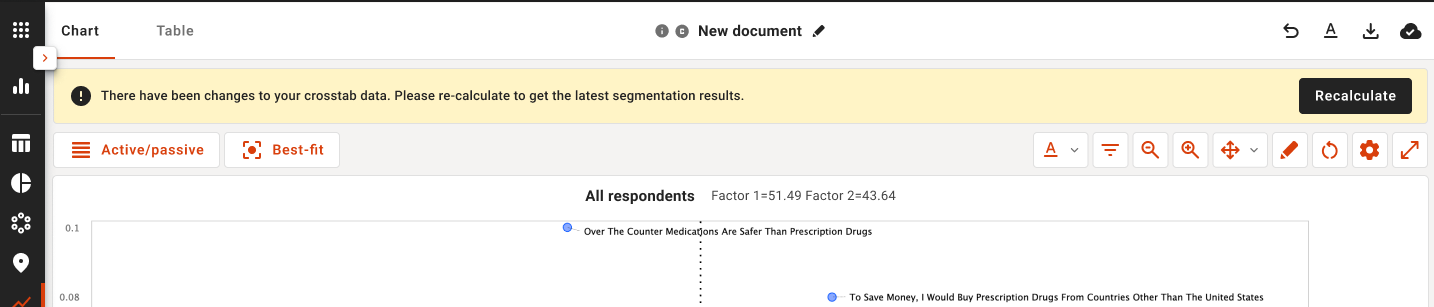
- When the data in crosstab is different from a Segmentation session, a notification will now alert to this discrepancy
- Correspondence Analysis now differentiates between rows and columns
Bug fixes
- Codebook categories and sub-categories no longer become randomly unselectable
- Fixed a bug where items within the codebook would randomly become unclickable until a full refresh of Explore is done
- Quick reports no longer switch to View Only mode when editing a Quick report
- Tablebase title mode retains its setting when exported
- Updating a report now shows the proper location
- Modified by snackbar now only shows up when in a collaborative document
- Separated rank export now works as expected
- Combining items no longer shows a brackets in the title of the new code
- Adding a custom audience to the crosstab no longer adds brackets