
Templates: How to build and Use Templated Reports
Discover’s Templates are customizable dashboards that provide one-click access to pre-built combinations of tables and charts around popular data use cases and topics. These are particularly helpful for running quick brainstorming sessions, and many Discover clients use them as a starting point to identify interesting areas for more in-depth research. You can customize existing templates, or create your own from scratch based on the data points you use most frequently. You can share these dashboards with other Discover users directly in the tool or export them to share with other colleagues or partners. Templates are a great resource when you have specific data tables and charts that you use frequently. For example, let’s say you are analyzing several auto brand audiences. You can build a car-related custom summary for BMW’s audience, then use the same summary again for Audi, Mercedes, Volvo and so forth.
Using Discover's Pre-built Templates
- Build and analyze your query.
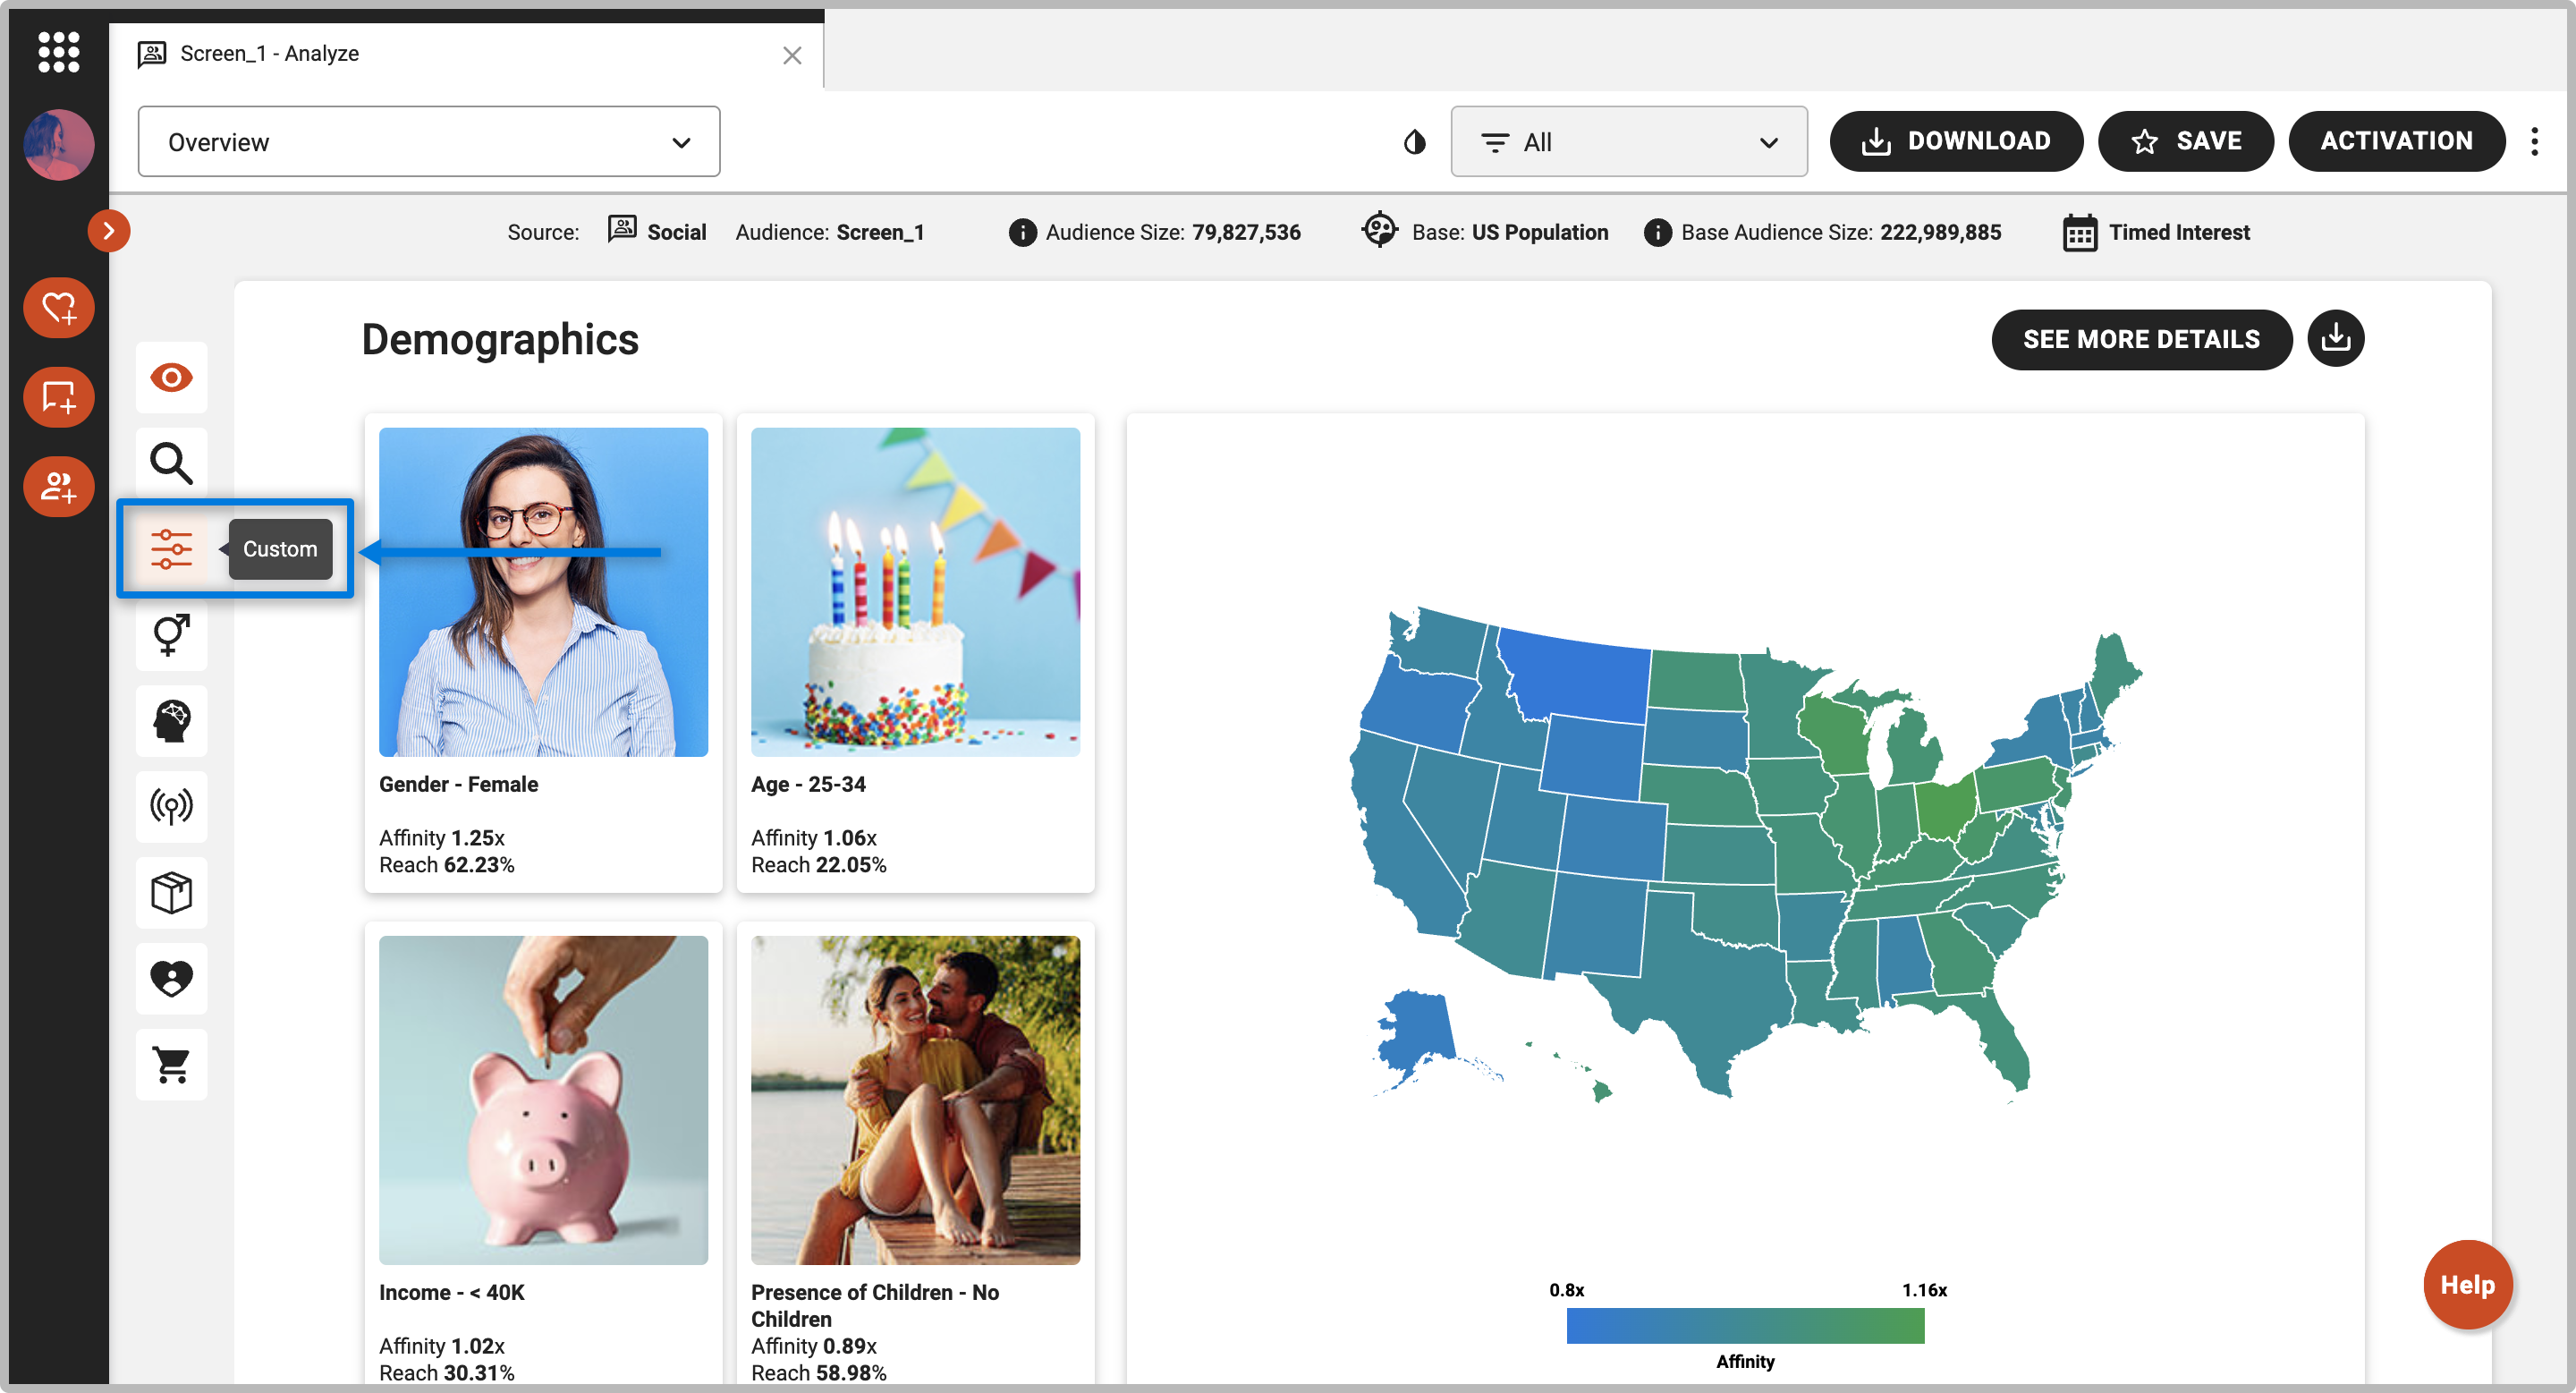
- Navigate to the “Custom” section
on the left-hand side of the tool.
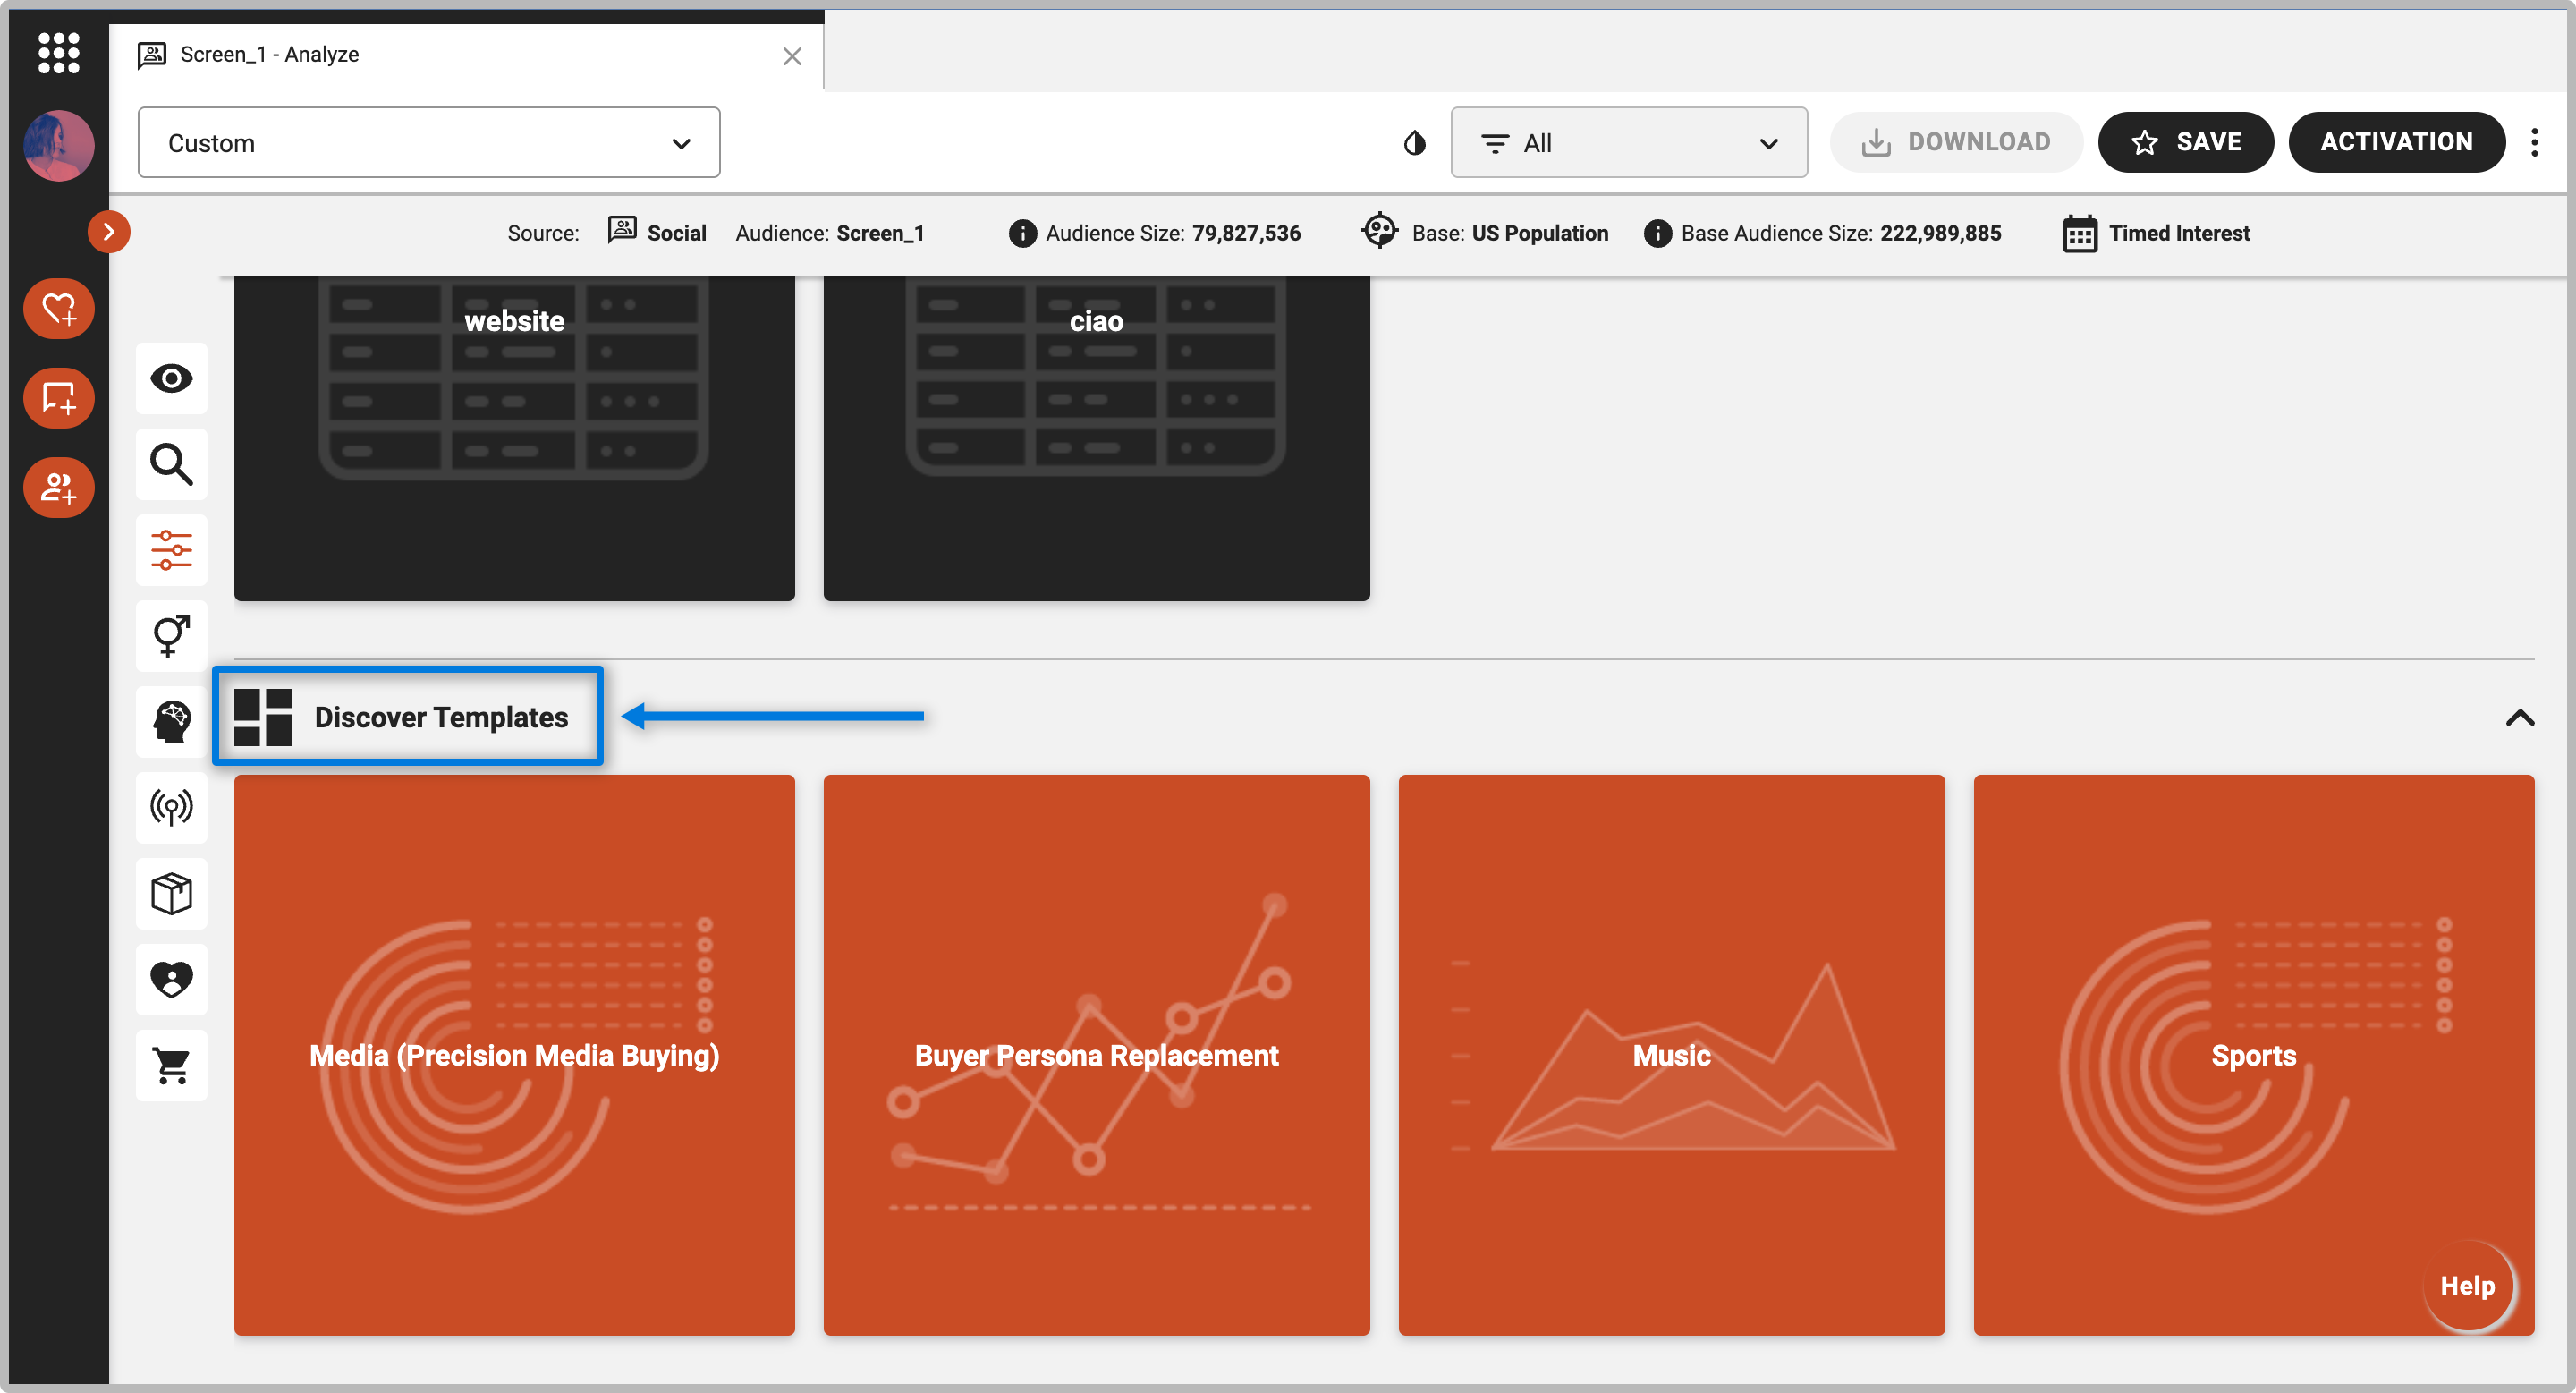
- Scroll down to the bottom of the page, until you see “Discover Templates.”
- Click on the template that you would like to open. For example, Media, Buyer Persona, Music, or Sports.
You can also navigate to our pre-built templates using the dropdown menu in the top left navigation.
Creating a Custom Template from Scratch
- Build and analyze your query.
- Navigate to the “Custom” section on the left-hand side of the tool.
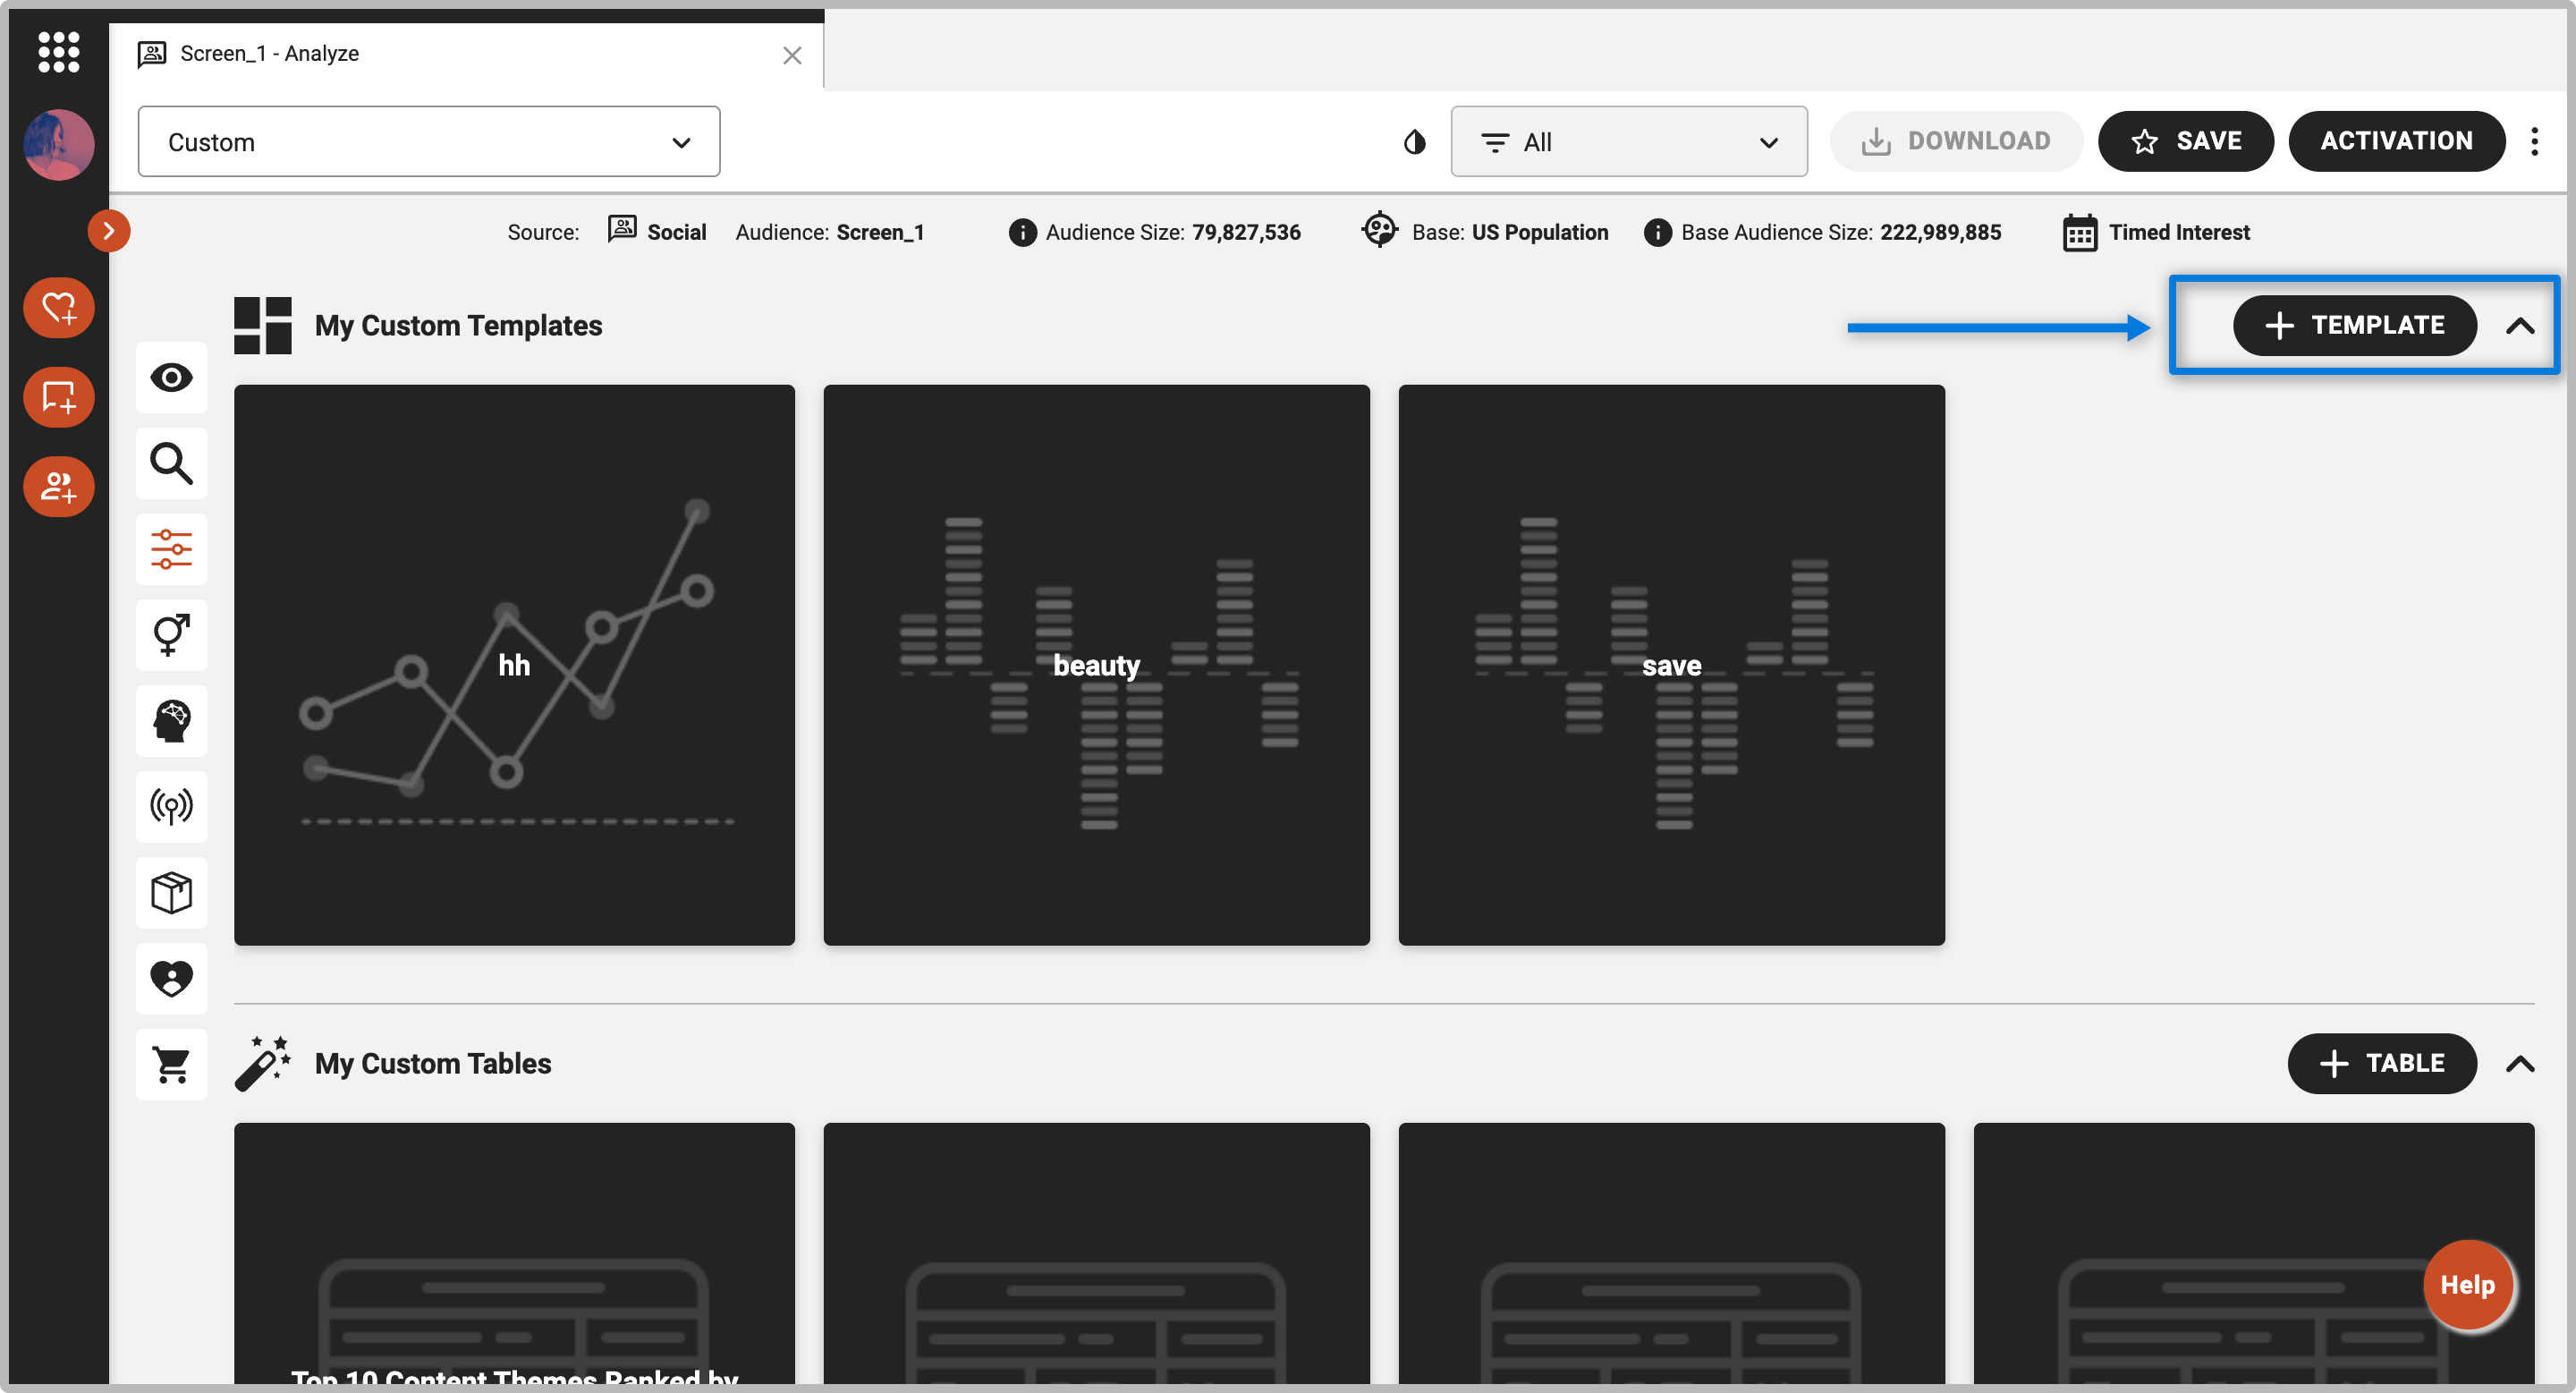
- On the top right area of the screen, select + TEMPLATE. This will create a blank Custom Template.
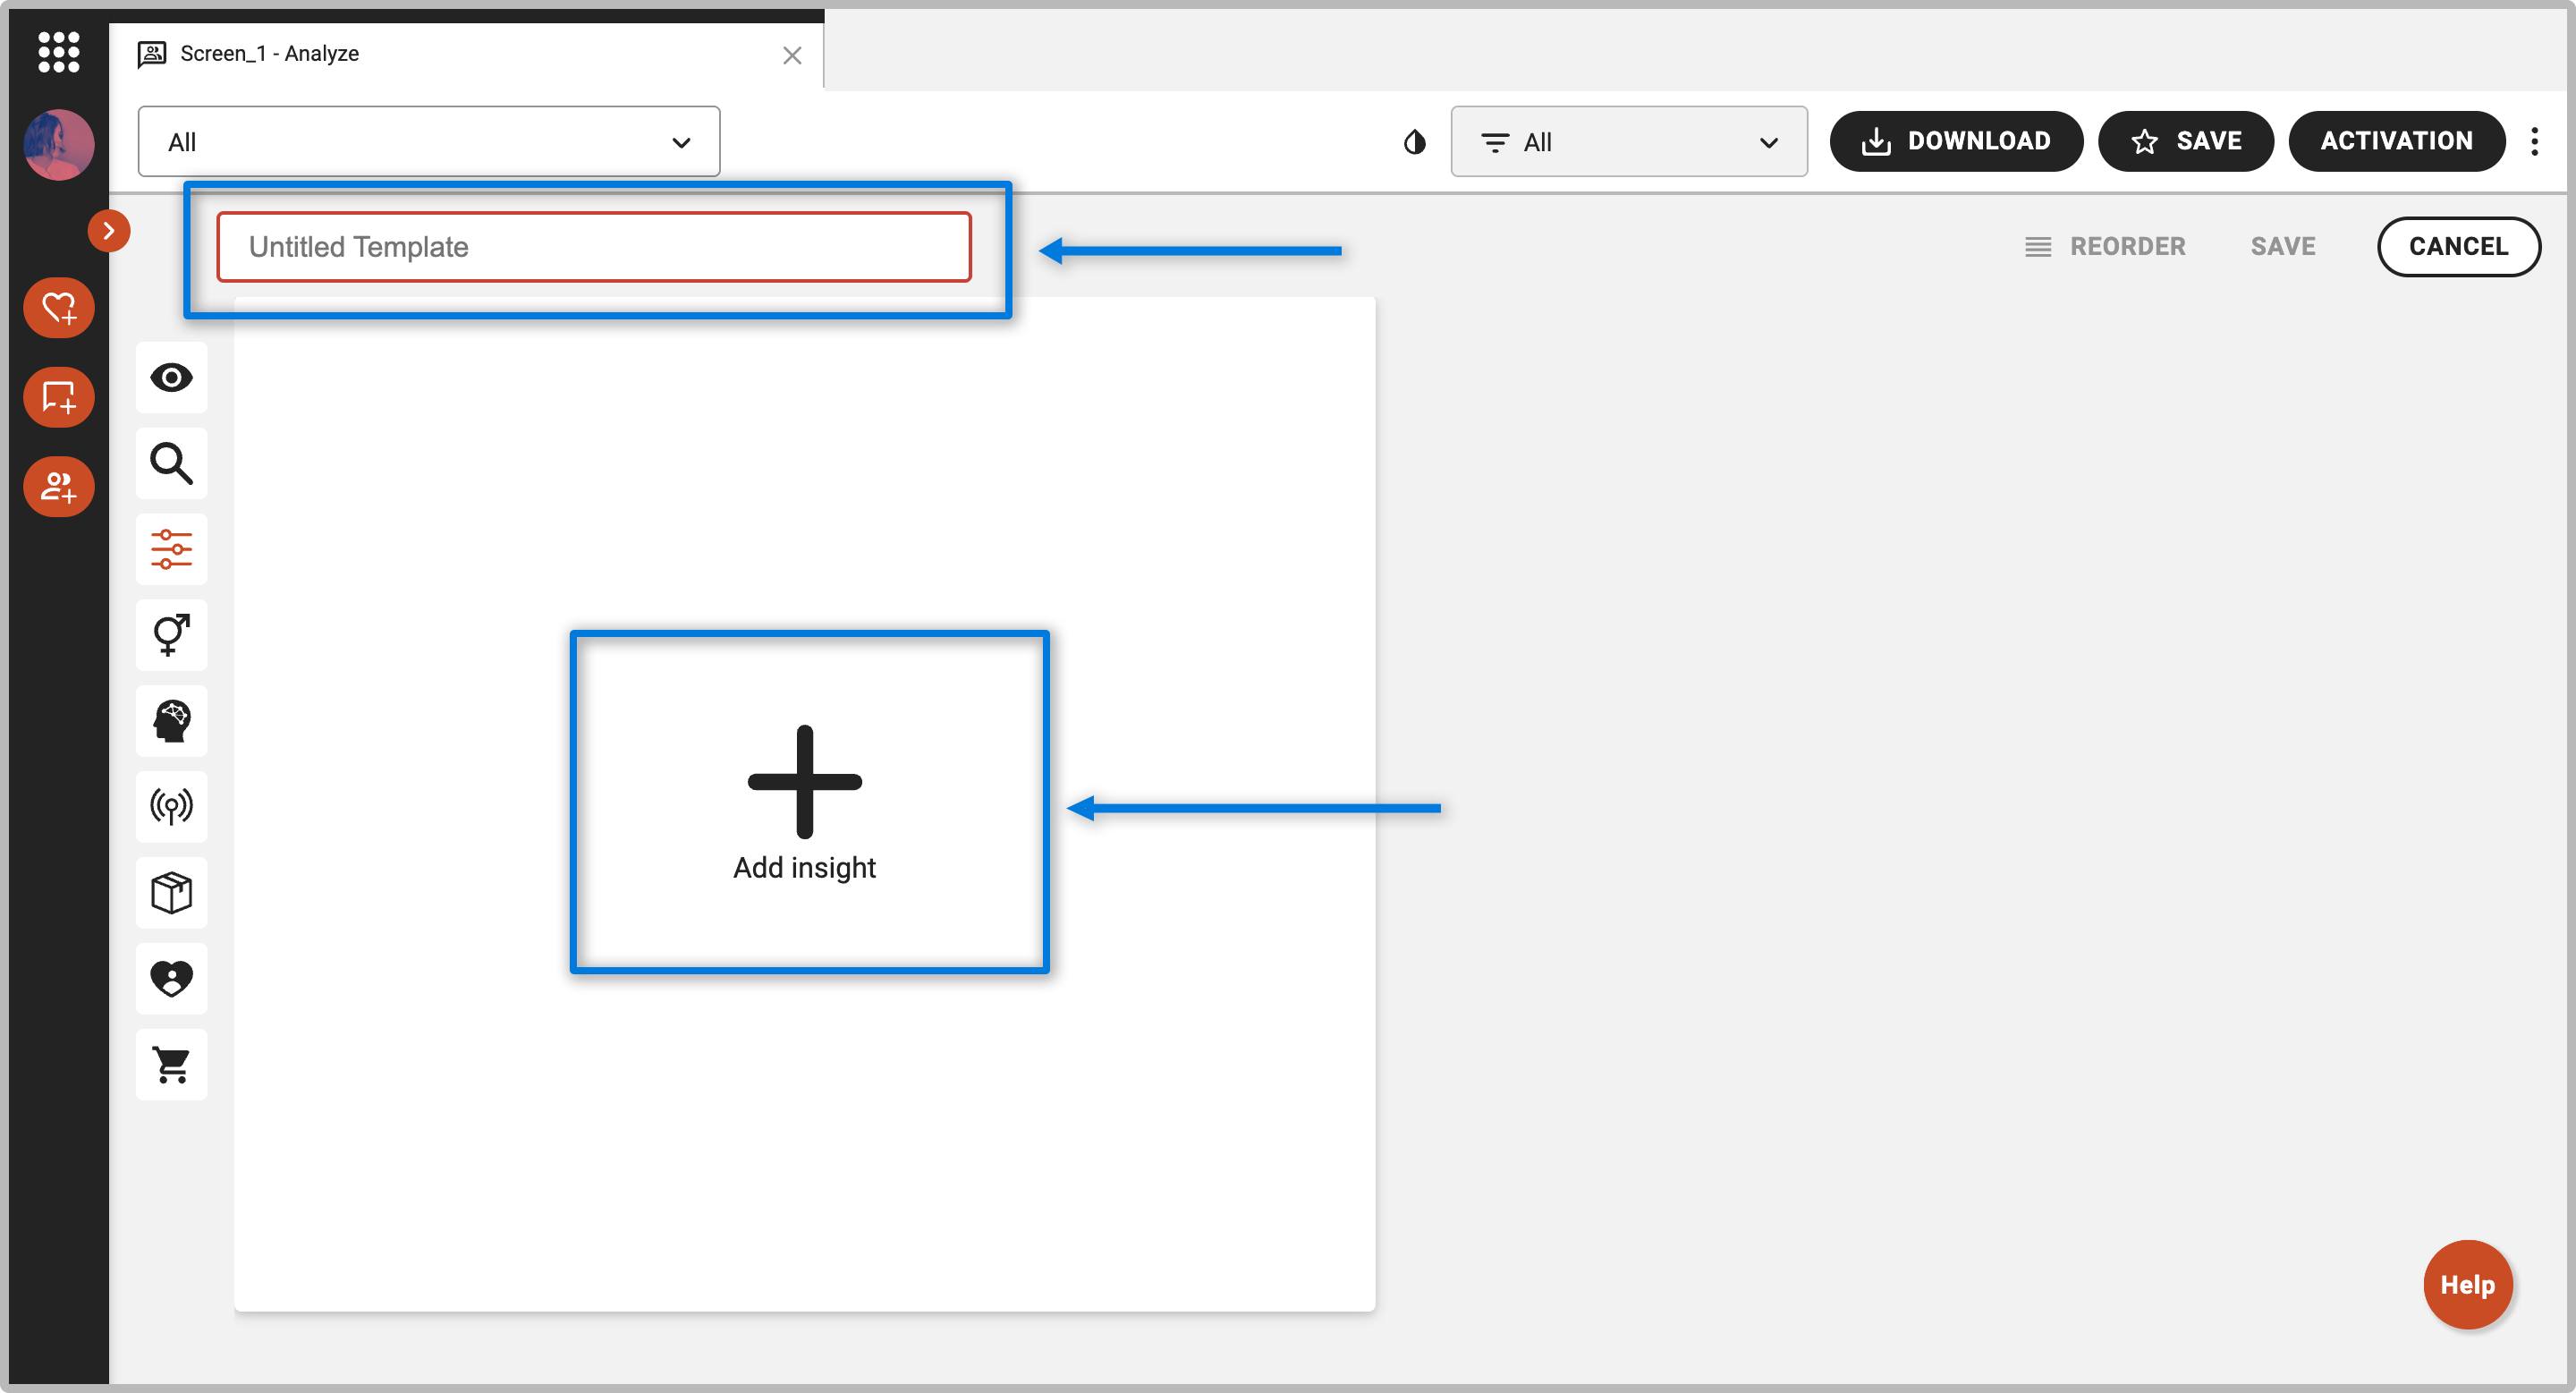
- Give your template a name by typing on the field. By default, it will say “Untitled Template.” Note: you must name your template in order to save it.
- To start adding tiles, click the big plus sign above “add insight.”
- From here, you can use the dropdown menu to navigate and select the data points you would like to include.
- Continue hitting the big plus sign until you have all of the tiles you need.
- Once you are finished, hit “save.”
- You can now use this Custom Template for any audience.
Adding Charts and Tables While Browsing the Discover Platform
As you are navigating throughout the platform, you may notice a certain chart or table that you would like to save and add to a report for future reference.
- Make sure you have already created a Custom Template from within the Custom section, using the instructions above.
- Within the Demographic, Lifestyle, Media, Products & Services, or Influencers sections, select the plus sign
on the top right of any table or chart.
- Check the box next to the template or templates you would like to add this table or chart to.
- Select “apply.”
- That table or chart will now appear at the bottom of the selected templates.
Editing and Reordering Custom Templates
- Navigate to the “Custom” tab and click to open the template you would like to edit.
- Select “Edit template” in the top left corner of your screen to go into editing mode.
- From here you can edit individual tiles, or type on the filed to rename the title of your template.
- Selecting the pencil icon on any individual chart will allow you to change the chart visualization type, and customize the visualization further depending on which chart type you select. For example, if the data is sorted by reach, base, or affinity.
- Select the ellipses on any individual tile to switch between displaying a table, chart or table and chart.
- To re-order your table, select “reorder” on the top right side of your screen.
- Drag the tiles around to place and rearrange them in your template.
- Once you are finished editing your custom template, select the lower “save” button on the right side of your screen.
Downloading/Exporting Templates
- From within your template, click “download” on the top right-hand side of the screen.
- Click to select if you would like to download the template as a PDF Document, PPT Presentation, or XLS Spreadsheet.
- Select “download” on the popup to being downloading your file.