
Crosstab
Crosstab
The crosstab is the default view seen when a new report is created or an existing report is opened.
Applying crosstab filters
Applying highlights & heatmaps
Snapshots
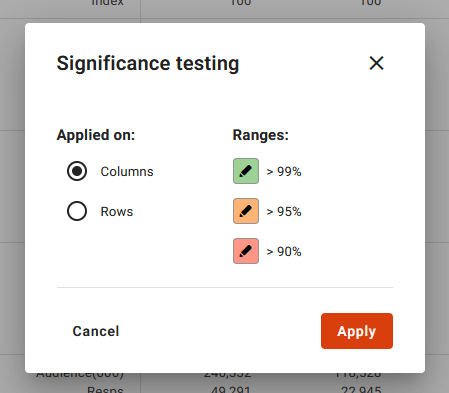
Significance testing
The significance testing allows for statistically significant cells in the crosstab to be highlighted. To use this, open the Significance testing modal from the report settings menu.
If, for example, Columns is chosen, and the first Column is Men then, for each row, the program will analyse the significance of the result against the same data for ‘Not Men’.
It is important to note that NOT Men does not always mean Women, it simply means any value that is not defined as Men in the dataset, per the column definition.
This differs from some other systems that compare against the Total column. However, since every column is included within the total it is much more informative to compare against the NOT definition
The significance is based on the standard t-test for two sample of different sizes. The colours reflect:
- White – no significant difference
- Red – Significant at 90% level
- Orange – Significant at 95% level
- Green – Significant at 99% level
It should be emphasized that the comparison of Col/Row v NOT Col/Row depends on the tablebase as it is all within the tablebase.