Reach Curves (Bespoke Media)
User can now plot Reach Curves for Bespoke Media as well - Reach Curves feature is a highly visual and interactive way for Planners to understand the relationship between media metrics such as Gross Rating Points and audience reach, and be able to pinpoint optimal vantage points across media type, media vehicles and audience distribution to create and define more targeted media plans.
Reach curves can be calculated for single media or cross media scenarios. The calculation is based on a natural laydown of buying media. That is, a contribution of budget or ratings split based on average media consumption
Reach curves are now available for all bespoke media except DAU/MRF, Total RF, and OOH Bespoke Media.
Reach curves are plotted showing reach growth at increasing levels of usage of media. The Y-axis representing reach and the x-axis representing GRPs or budget. Default values are used to initialise these plot points to create the reach curve. The user can customise the start and end rating and the increments between points to define different granularity and focus for their curves.
The user can interact with reach curves by viewing and comparing the curves for selected media types, media vehicles or across their audience definitions. The curves update dynamically based on which selection you are viewing. You can also enhance your view by adding the ‘total’ view depending on the selection (type/vehicle/audience). Or for complex plans you can cleanse your view to just see the top 10 media vehicles. The user can also select or deselect types/vehicles/audiences to show or hide them from the reach curve graph.
When plotting reach curves, budget considerations can also be factored in at the media vehicle level when costs are defined within the data.
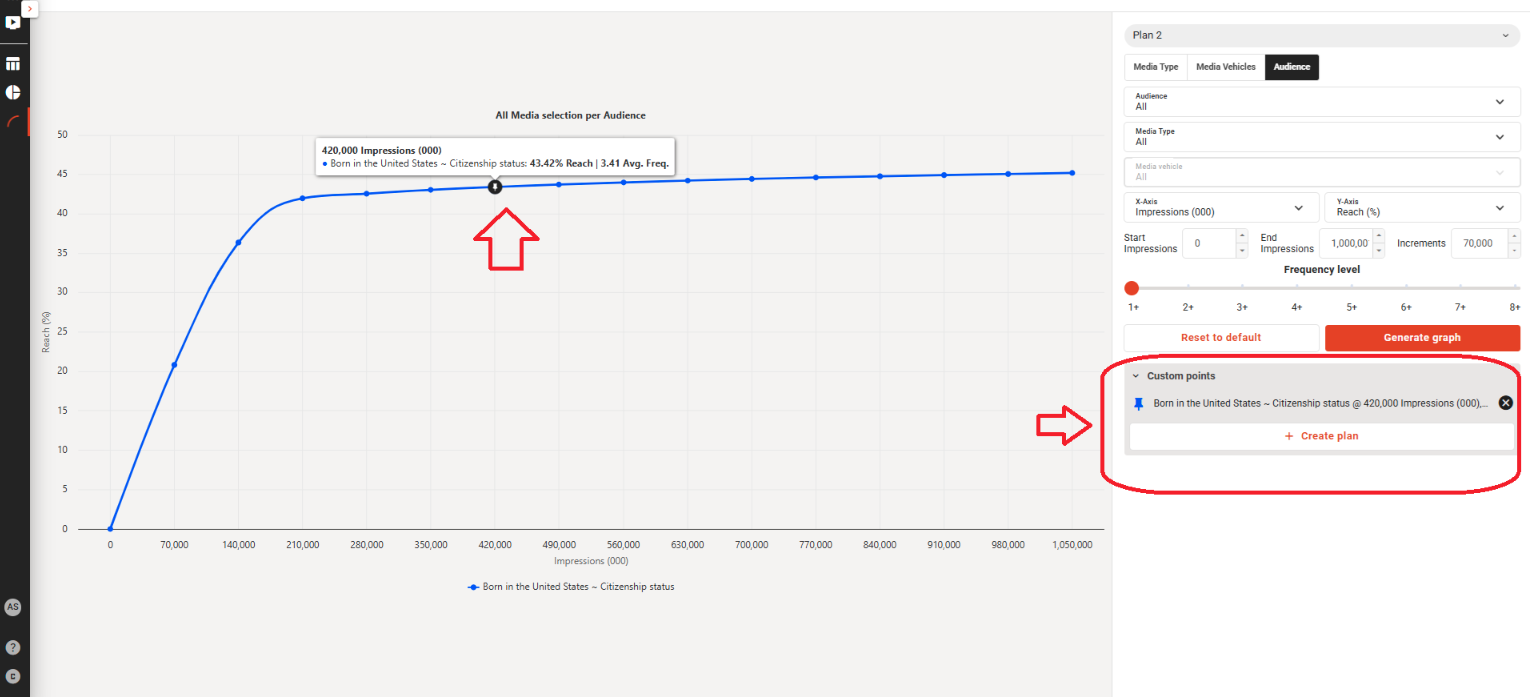
A user can select or pin different or optimum points on each reach curve for type/vehicle/audience, we call this ‘custom points’, to create a new plan based on these selected or pinned metrics. Therefore making it easy to illustrate different strategies and convert them into optimum plans based on your reach, GRP or budget goals.
- Reach curves are internally using a set of 20 schedules, geometrically spaced in number of GRPs, i.e. the higher the GRPs the larger the gap between evaluation points. This leads to a number of sets of 20 (GRP,Reach,Cost) points, each combination of vehicles and target will have different points. These points are then interpolated to create a curve that uses the points requested. This is done for performance reasons, as it avoids having to run separate schedules per target/media group which would lead to impossibly long evaluations. So the reach mentioned for a point on the curve is not the result of a schedule that was evaluated, but an interpolation. It should be quite close though.
- Reach curves use an idealised schedule, i.e. it uses insertions (or spots/pageviews) that match exactly the GRP, and use all vehicles. When creating an actual plan from GRP insertions for TV/Radio/Print must be integer, hence vehicles do not get the same insertions. As an example for TV the evaluation for reach curves could do 0.1 spots in each daypart for 30 GRPs, where an actual schedule would have maybe 5 dayparts with insertions, which also leads to a different reach. And it would not match 30 GRPs exactly. This behaviour can be seen in ChannelPlanner when compared to MediaPlanner. One good reason for this is that it leads to smooth growth, where using an actual schedule could lead to declining reach e.g. when going from a single spot with 4 GRPs (i.e. 4 reach) to 2 spots with ratings 2 and 3, 5 GRPs but possibly reach <4.
- Natural delivery across media types: In this case we have decided to make a breaking change: Where in Channel Planner (old version) we would make up an insertion equivalent for digital media, in Plan we use a 2-step approach, with an initial step determining the split between mediatypes based on reaches, and a second run that uses the split found to allocate per mediatype individually. This applies to Plan Channel Planner as well as to Reach curves and regular natural delivery. This leads to a better spread across mediatypes. In a single natural delivery as we have in Channel Planner and regular Plan allocation we use the GRP/budget requested, in Reach curves as we have no single input we use the highest GRP that is used for the 20 input points. This means an actual natural delivery based on overall GRPs (across mediatypes) can differ from the what is used for the curve.
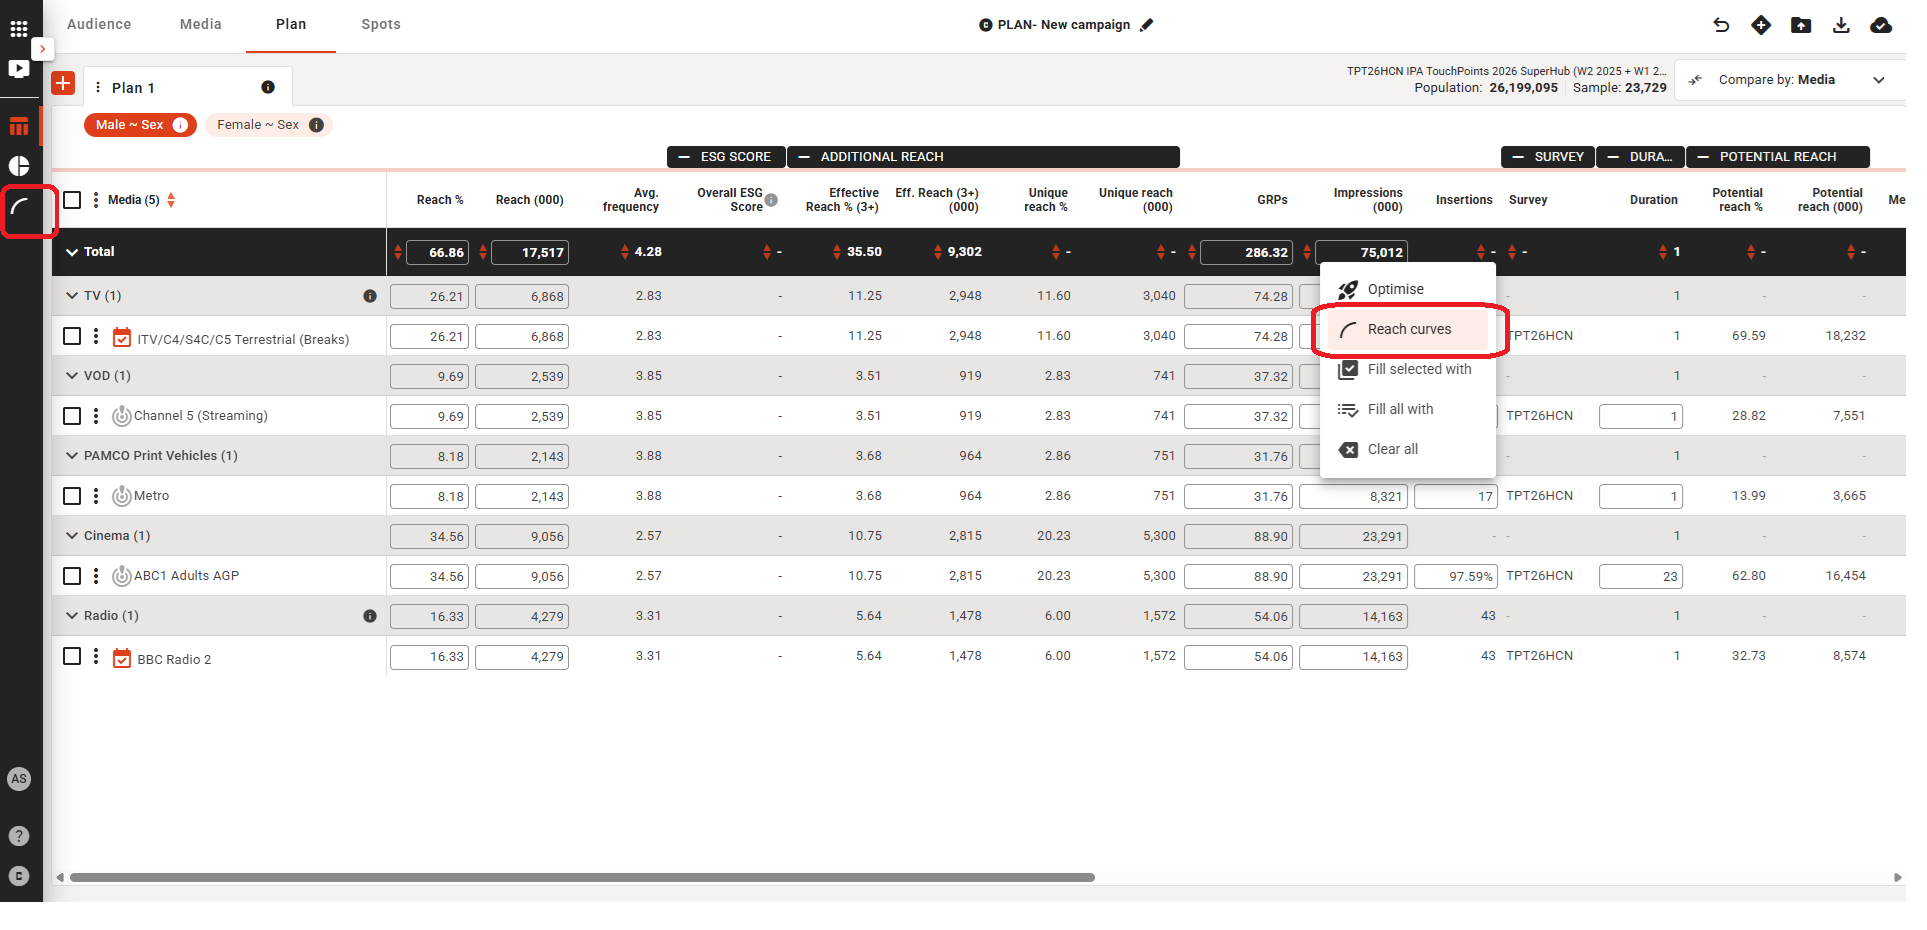
Launch Reach Curves from the Nav Bar and Planning Table:
A user can start plotting Reach Curves by clicking on the option available from the Nav Bar and from the Cell option from the Planning Table (as below)
Plotting Reach Curves based on Default values:
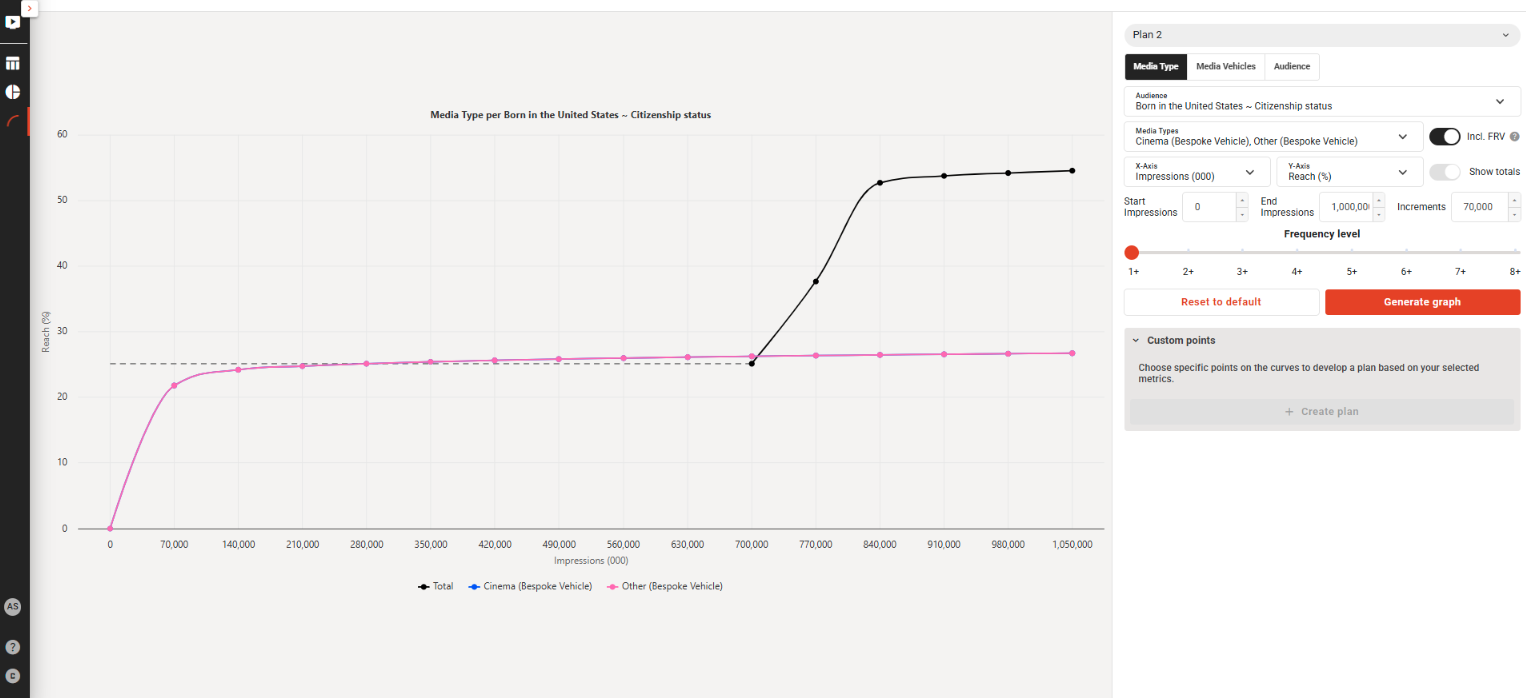
As soon as a user lands on the Reach Curves tab, System plots Reach Curves based on default values. User is able to select plan (schedule) when a user lands on the Reach Curves screen. First plan (schedule) is selected by default. Only one plan (schedule) can be selected at any given time.
User is able to Plot Reach Curves as per the selected values:
Following options are available:
- Media Type
- User is able to select plan (schedule) when a user lands on the Reach Curves screen. First plan (schedule) is selected by default. Only one plan (schedule) can be selected at any given time.
- Under this tab, user can change Audience/ Media Types / X-axis / Y-Axis values and Generate graph
- User can also change Start Impression/rating and End Impression/rating and can also change increments values and Generate graph
- User can also increase/decrease Frequency Level and Generate graph
- User can click on the ‘Show Totals’ toggle to plot Totals’ figure Reach Curve and update Reach Curves
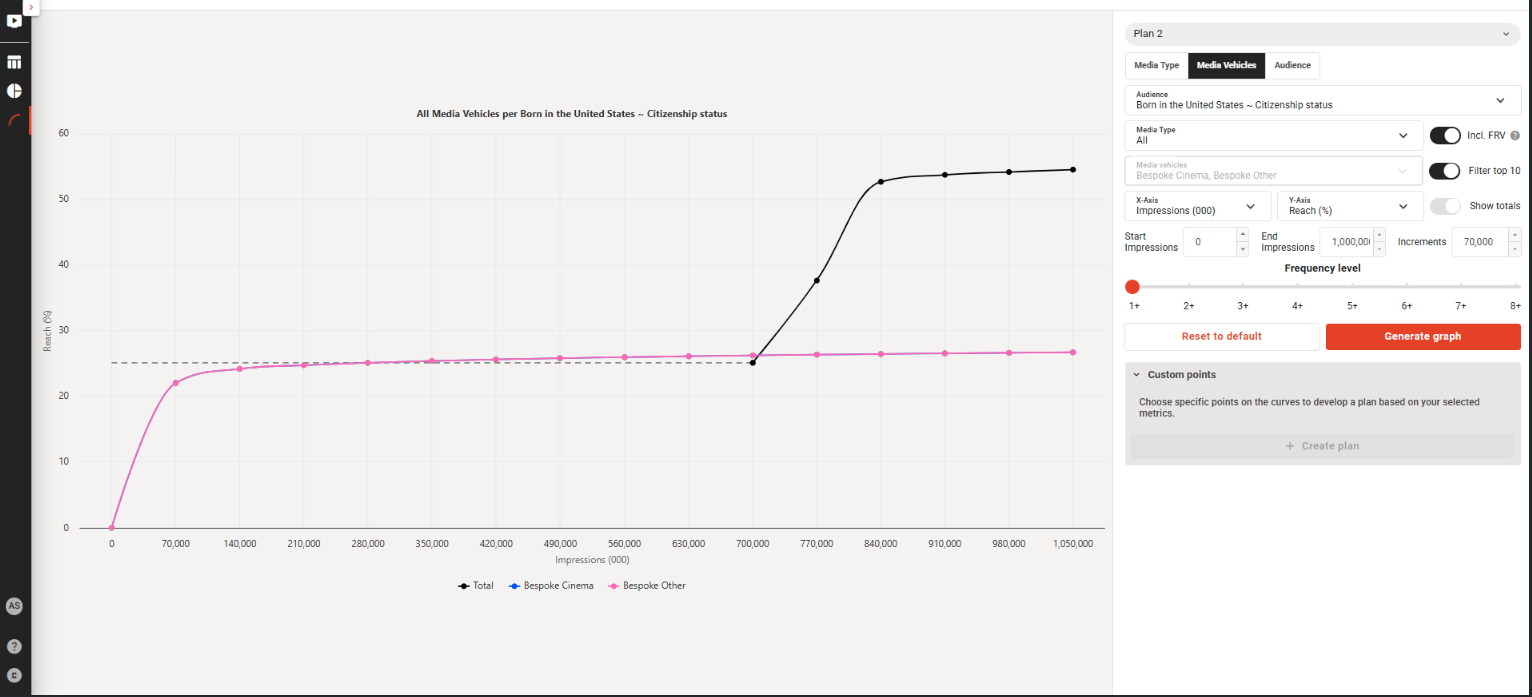
- Media Vehicles
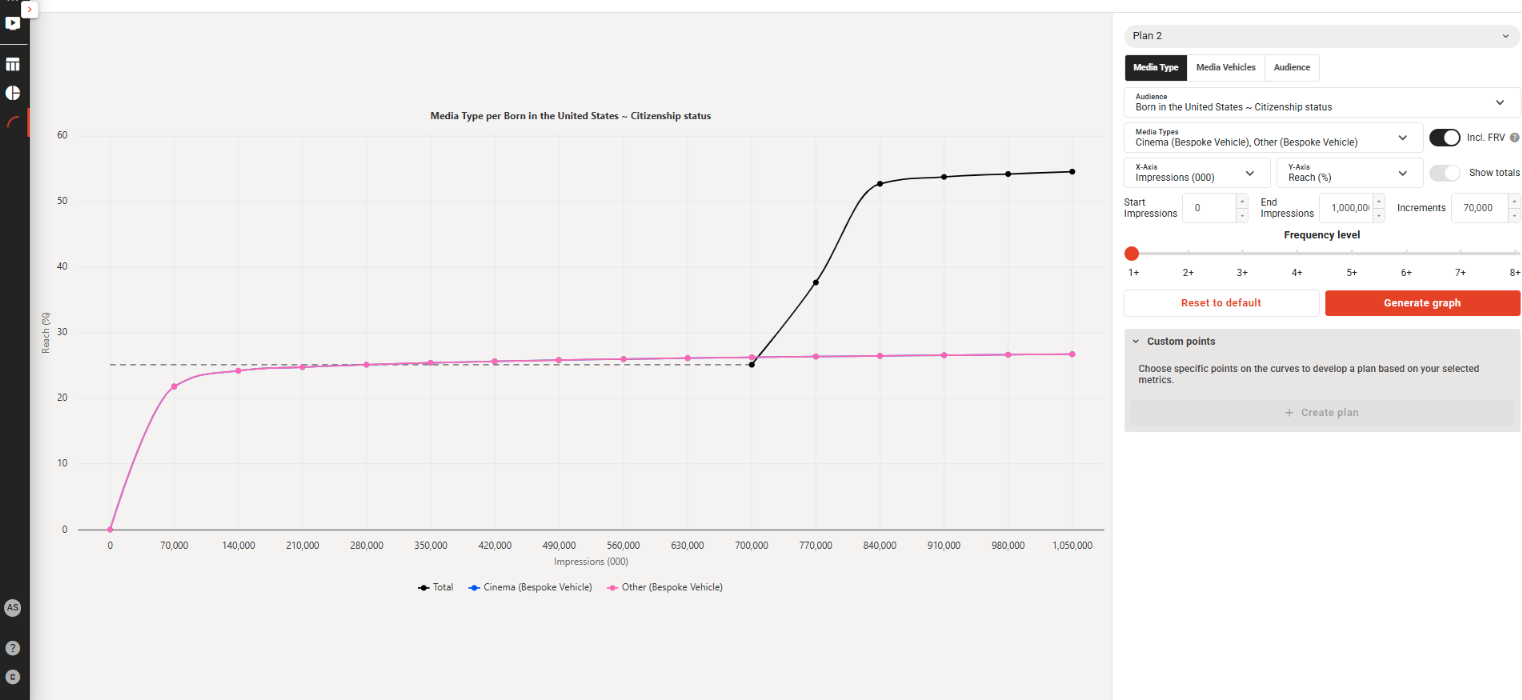
- Under this tab, user can change Audience/ Media Types / Media Vehicle/ X-axis / Y-Axis values and Generate graph
- User can also change Start Impression/rating and End Impression/rating and can also change increments values and Generate graph
- User can also increase/decrease Frequency Level and Generate graph
- User can click on the ‘Show Totals’ toggle to plot Totals’ figure Reach Curve and update Reach Curves
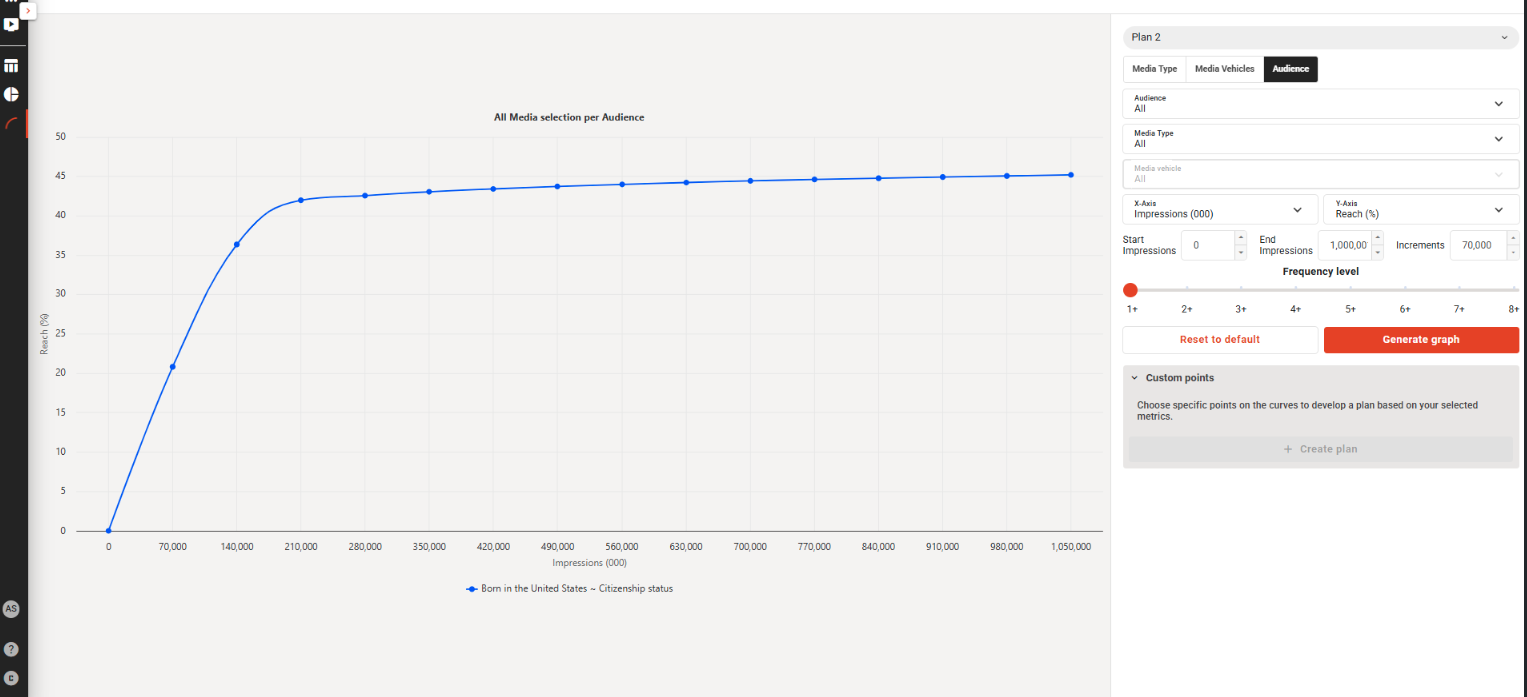
- Audience
- Under this tab, user can change Audience/ Media Types /Media Vehicles/ X-axis / Y-Axis values and Generate graph
- User can also change Start Impression/rating and End Impression/rating and can also change increments values and Generate graph
- User can also increase/decrease Frequency Level and Generate graph
Ability to create Plan using Custom Points:
- User can click any specific point on the plotted curve and add that point as ‘Custom Point’
- This option is available from the following tabs:
- Media Type
- Media Vehicles
- Audience